


ABSTRACT:
OBJECTIVES: Major depressive disorder (MDD) is one of the most disabling mental illnesses and
it has a significant impact on society. This review aims to provide updated scientific
evidence about the epidemiology of MDD.
METHODS: A systematic literature review of the PubMed and MEDLINE databases was performed to
identify articles on the prevalence of MDD and its correlates. The search was restricted
to manuscripts published between January 2001 and December 2018.
RESULTS: Sixty-three articles were included in the review. The lifetime prevalence of MDD ranged
from 2 to 21%, with the highest rates found in some European countries and the lowest
in some Asian countries. The main sociodemographic correlates were separated/divorced
marital status and female gender. Child abuse, intimate partner violence, and comorbidity
with other physical and mental disorders also were consistently associated with MDD
across the reviewed studies.
CONCLUSIONS: MDD is a highly prevalent condition worldwide. There are remarkable interregional
differences in the disorder's prevalence, as well as in certain sociodemographic correlates.
MDD is also highly comorbid with physical and mental health problems.
Keywords: Major depressive disorder; prevalence; comorbidity; epidemiology; chronic physical conditions.
FIGURES
| Received: August 18 2019; Accepted: March 3 2020 |
INTRODUCTION
Major depressive disorder (MDD) is one of the most prevalent mental disorders worldwide, as well as one of the most disabling. According to the Global Burden of Disease study, depression is the fourth leading cause of disability (measured in disability adjusted life years), and it is expected to be the second by 2020.1 MDD has a greater impact on public health than physical conditions such as coronary heart disease, rheumatoid arthritis, or diabetes mellitus.2 Its economic impact is also considerable.3-5 Information on the prevalence and correlates of MDD is key to its prevention and management.
Since the 1980s, a number of population surveys have explored the prevalence of mental disorders. Some of the first large-scale studies were the Epidemiologic Catchment Area (1980-1985)6 and the National Comorbidity Survey (1990-1992),7 both conducted in the United States. It took several years before such studies were conducted in developing countries. Although a number of surveys have been carried out in recent years, their methodological differences make it difficult to obtain comparable results, even within the same country. This issue has been addressed by the World Health Organization through the World Mental Health project, a series of population surveys of identical methodology conducted as a coordinated effort in several countries.8 Nevertheless, some authors are questioning whether it is valid to apply the same methodology to Western and non-Western settings.9
It is assumed that the etiopathogenesis of MDD is the result of a complex interaction between biological and psychosocial factors and, although many studies have explored them over the years, they are far from being entirely elucidated. This systematic review offers a synthesis of current evidence about the epidemiology of MDD, exploring its prevalence, sociodemographic correlates, and potential risk factors in countries worldwide.
METHODS
This review is divided into two parts, each with different inclusion/exclusion criteria and search strategies. The first part involves articles about MDD prevalence and sociodemographic factors, while the second involves articles about potential risk factors in the areas of traumatic experiences, physical health, and mental health. Applicable Preferred Reporting Items for Systematic Reviews and Meta-Analyses guidelines were complied with.10 This protocol has not been registered.
Inclusion/exclusion criteria
Cross-sectional articles on MDD prevalence in the adult community-based population were included in the first part of the review. MDD was diagnosed according to ICD-10,11 DSM-IV,12 or DSM-513 criteria using valid scales and face-to-face interviews. The minimum sample size was set at 1,000 participants to increase the quality of the studies. We excluded all studies conducted among special populations (specific professions or groups of patients), those that used telephone interviews, those based on depressive symptoms rather than a complete diagnosis, and those that made no distinction between MDD and other affective disorders.
The second part included articles on the relationship between MDD and relevant risk factors, which were selected according to previous evidence14-16: child abuse, stressful life events, gender violence, chronic illness, mental illness, personality traits, and toxic substance exposure. Both cross-sectional and longitudinal studies were accepted. In addition to the above-mentioned diagnostic criteria, DSM-III criteria were also accepted for this part of the review to allow inclusion of prospective studies begun prior to the creation of the DSM-IV. All studies that included self-reported cases of MDD, those based on symptoms rather than a diagnosis, and those that did not distinguish between MDD and other affective disorders were excluded. Given that this type of study has smaller samples than observational studies, the sample size was reduced to a minimum of 100 participants.
Search strategy
For both parts, a search was performed in the PubMed and MEDLINE databases. Additional articles were retrieved from ResearchGate by inspecting the reference list of reviewed articles and consulting experts in the field. The search terms for articles about prevalence and sociodemographic factors were: (MDD[Title/Abstract]) AND prevalence[Title/Abstract]). The search was restricted to articles published in English or Spanish. Manuscripts in press were included if access was granted. For both parts, the publication date was limited to the 21st century (2001-2018) for more current results.
The MEDLINE search terms for the articles about risk factors were: MDD[Title/Abstract] AND (risk factors[Title/Abstract] OR personality[Title/Abstract] OR obesity[Title/Abstract] OR correlates[Title/Abstract] OR comorbidity[Title/Abstract] OR alcohol[Title/Abstract] OR smoking[Title/Abstract] OR abuse[Title/Abstract] OR violence[Title/Abstract] OR chronic conditions[Title/Abstract]). A similar search format was used in the PubMed database. The articles were selected according to their relevance and quality. We used critical appraisal checklists to assess quality.17
Two researchers (AP-S and HD) independently assessed the articles for inclusion. Agreement between reviewers, measured by intraclass correlation coefficient (ICC), was 0.81 (95% confidence interval [95%CI] 0.76-0.86). Differences between reviewers were resolved by discussion. Data extraction was performed by the same two researchers, using a purpose-built form. Data was collected on MDD prevalence and its association with independent variables, including effect sizes, which were expressed as odds ratio (OR) or hazard ratio (HR).
RESULTS
Study selection
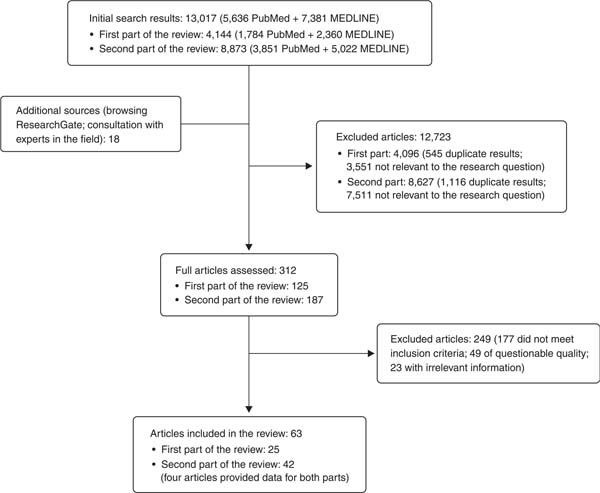
The initial search yielded 4,144 results for the first part of the review and 8,873 results for the second part, totaling 13,017 results. Following the initial screening, full-text revision and selection process, 63 articles were included in the final review. Twenty-five provided information about the prevalence and sociodemographic correlates of MDD (first part), while 42 assessed correlates of MDD related to physical health, mental health, and traumatic experiences (second part of the review). Since four of the 63 articles provided information for both parts of the review, they were counted twice (Figure 1).
Study characteristics
The 25 articles focusing on the prevalence and sociodemographic factors of MDD included data from 38 population-based surveys conducted in 29 countries. These studies were based on similar methodologies and had a cross-sectional design, allowing effective comparison between results. The majority included data about both the prevalence of MDD and the principal sociodemographic factors linked with the disorder. A total of 42 articles explored MDD risk factors. These articles were more heterogeneous, due to the variety of study designs (cross-sectional, retrospective and prospective). Recall bias, the limitations of the diagnostic tools, and study design were the most frequently reported limitations in the selected studies. We divided the results into five topics: MDD prevalence (25 articles), sociodemographic factors (17 articles), associations with traumatic experiences (14 articles), risk factors related to physical health (18 articles), and associations with mental health (19 articles).
Prevalence of MDD
Lifetime prevalence of MDD ranged from 2% in China,18 6.7% in South Korea,19 20.5% in Chile,20 to 21% in France.21 The 12-month prevalence ranged between 1.1% in China18 and 10.4% in Brazil.21 By continent, the highest prevalence was in Europe21,22 and the lowest in Asia.18,19,21-23 In European countries, average lifetime prevalence was 11.32% and average 12-month prevalence 5.2%.21,24-28 The full results are shown in Table 1.
| Study | Country | Age range (years) | Median age (years) | Data collection | n | Scales/criteria of MDD | Life prevalence (%) | 12-month prevalence (%) | Cross-sectional prevalence (%) |
|---|---|---|---|---|---|---|---|---|---|
| Assari29 | United States | = 18 | 41.73 | 2001-2003 | 1,271 | CIDI/DSM-IV | - | 4.71±0.6 | - |
| Bromet21 | Belgium | = 18 | 29.4 | 2001-2002 | 2,419 | CIDI/DSM-IV | 14.1±1.0 | 5.0±0.5 | - |
| France | = 18 | 24.3 | 2001-2002 | 2,894 | CIDI/DSM-IV | 21.0±1.1 | 5.9±0.6 | - | |
| Germany | = 18 | 18.8 | 2002-2003 | 3,555 | CIDI/DSM-IV | 9.9±0.6 | 3.0±0.3 | - | |
| Israel | = 21 | 23.5 | 2002-2004 | 4,859 | CIDI/DSM-IV | 10.2±0.5 | 6.1±0.4 | - | |
| Italy | = 18 | 28.4 | 2001-2003 | 4,712 | CIDI/DSM-IV | 9.9±0.5 | 3.0±0.2 | - | |
| Japan | = 20 | 27.6 | 2002-2006 | 3,416 | CIDI/DSM-IV | 6.6±0.5 | 2.2±0.4 | - | |
| Netherlands | = 18 | 31.9 | 2002-2003 | 2,372 | CIDI/DSM-IV | 17.9±1.0 | 4.9±0.5 | - | |
| Spain | = 18 | 25.5 | 2001-2002 | 5,473 | CIDI/DSM-IV | 10.6±0.6 | 4.0±0.3 | - | |
| New Zealand | = 18 | 27.7 | 2004-2005 | 12,790 | CIDI/DSM-IV | 17.8±0.4 | 6.6±0.3 | - | |
| Brazil | = 18 | 30.1 | 2004-2007 | 5,037 | CIDI/DSM-IV | 18.4±0.8 | 10.4±0.6 | - | |
| Colombia | 18-65 | 23.8 | 2003 | 4,426 | CIDI/DSM-IV | 13.3±0.6 | 6.2±0.4 | - | |
| India | = 18 | 23.5 | 2003-2005 | 2,992 | CIDI/DSM-IV | 9.0±0.5 | 4.5±0.4 | - | |
| Lebanon | = 18 | 27.2 | 2002-2003 | 2,857 | CIDI/DSM-IV | 10.9±0.9 | 5.5±0.7 | - | |
| Mexico | 18-65 | 24.2 | 2001-2002 | 5,782 | CIDI/DSM-IV | 8.0±0.5 | 4.0±0.3 | - | |
| South Africa | = 18 | 22.3 | 2003-2004 | 4,315 | CIDI/DSM-IV | 9.8±0.7 | 4.9±0.4 | - | |
| Ukraine | = 18 | 30 | 2002 | 4,724 | CIDI/DSM-IV | 14.6±0.7 | 8.4±0.6 | - | |
| China | = 18 | 27.8 | 2006-2007 | 7,132 | CIDI/DSM-IV | 6.5±0.4 | 3.8±0.3 | - | |
| Bunting24 | United Kingdom | = 18 | - | 2004-2008 | 4,340 | CIDI/DSM-IV | - | 7.9±1.6 | - |
| Chen30 | China | 30-79 | - | 2004-2008 | 512,891 | CIDI/DSM-IV | - | 0.7 | - |
| Cho19 | South Korea | 18-74 | 29.2 | 2011 | 6,022 | CIDI/DSM-IV | 6.7±1.2 | 3.1±0.8 | - |
| Goldney22 | Australia | = 15 | 30.4 | 2008 | 3,014 | PRIME-MD/DSM-IV | 10.3±1.1 | - | - |
| de Graaf25 | Netherlands | 18-64 | 22.7 | 2007-2009 | 6,646 | CIDI/DSM-IV | 18.7±1.2 | 5.2±0.6 | - |
| Gureje31 | Nigeria | = 18 | - | 2002-2003 | 6,752 | CIDI/DSM-IV | 3.1±0.6 | 1.1±0.2 | - |
| Hasin32 | United States | = 18 | - | 2000-2001 | 43,093 | AUDADIS-IV/DSM-IV | 13.2±0.6 | 5.3±0.3 | - |
| Jacobi26 | Germany | 18-79 | - | 2009-2012 | 5,318 | CIDI/DSM-IV | - | 6.0±0.8 | - |
| Kessler33 | United States | = 18 | - | 2001-2002 | 9,090 | CIDI/DSM-IV | 16.2±1.1 | 6.6±0.7 | - |
| Kiejna27 | Poland | 18-64 | - | 2010-2011 | 10,081 | CIDI/DSM-IV | 3.0±0.3 | - | - |
| Kleinberg34 | Estonia | 18-84 | - | 2006-2008 | 6,105 | MINI/DSM-IV | - | - | 5.6±0.6 |
| Klijs35 | Netherlands | = 18 | 43.7 | 2006-2012 | 71,058 | MINI /DSM-IV | - | - | 2.5 |
| Liu23 | China | = 18 | - | 2010 | 16,032 | SCID/DSM-IV | 3.6±0.3 | - | 1.1±0.2 |
| Lu18 | China | = 15 | - | 2005-2006 | 5,033 | CIDI/DSM-IV | 2.0±0.5 | 1.09±0.3 | 0.9±0.3 |
| Markkula28 | Finland | = 30 | - | 2011 | 6,005 | CIDI/DSM-IV | - | 7.4±1.7 | - |
| Markkula20 | Chile | = 17 | - | 20032010 | 5,4697,212 | CIDI-SF/DSM-IV | 20.5 ±2.218.4± 1.8 | - | - |
| Mohammadi36 | Iran | = 18 | - | 2001 | 25,180 | SPI/DSM-IV | 3.0 | - | - |
| Munhoz37 | Brazil | = 20 | - | 2006-2010 | 2,925 | PHQ-9/DSM-IV | 20.4 | - | - |
| Piazza & Fiestas38 | Peru | 18-65 | - | 2004-2005 | 3,930 | CIDI/DSM-IV | - | 2.7±0.4 | - |
| Porras-Segovia39 | Spain | 18-80 | 42.8 | 2011-2012 | 810 | MINI /DSM-IV | - | - | 5.6±0.7 |
| Slone40 | Mexico | = 18 | - | 1999-2001 | 2,509 | CIDI/DSM-IV | 12.8±1.4 | 6.1±1.0 | - |
| Smith41 | United Kingdom | - | 54.5 | 2006-2010 | 172,751 | CIDI/DSM-IV | 6.4 | - | - |
| Topuzoglu42 | Turkey | 15-64 | - | 2007-2008 | 4,011 | CIDI/DSM-IV | - | 8.2±0.9 | - |
- = no data provided; AUDADIS-IV = Alcohol Use Disorder and Associated Disabilities Interview Schedule-IV; CIDI = Composite International Diagnostic Interview; CIDI-SF = Composite International Diagnostic Interview-Short Form; MDD = major depressive disorder; MINI = Mini International Neuropsychiatric Interview; PHQ-9 = Patient Health Questionnaire-9; PRIME-MD = Primary Care Evaluation of Mental Disorders; SCID = Structured Clinical Interview for DSM Disorders; SPI = Standard Psychiatric Interview.
Sociodemographic factors
Among the sociodemographic factors linked to MDD, two stand out: female sex and being separated/divorced. Female sex was significantly associated with MDD in 26 of the 30 studies exploring this factor. A non-significant result was found in surveys undertaken in Belgium and Nigeria, as well as in two of the three surveys from China. Even when the results were not significant, depression rates were higher in women than men. OR values ranged from 1.4 in Australia22 to 2.8 in Iran.36 When controlling for other factors, the association between MDD and female sex prevailed in most studies21 and disappeared in a minority of them.39 The association between separation/divorce and MDD was statistically significant in 26 of the 29 population surveys that included this data. Compared to married people, the OR reached 8.2 in India21 and 19.3 in Lebanon, although the study's wide CI (5.0-74.4) makes the real effect size uncertain.21
Employment status was also consistently linked with MDD: unemployment was positively associated with depression in the eight studies in which this data was collected. Other sociodemographic factors, such as socioeconomic status (SES) or education level, were only associated with MDD in some of the articles. A study conducted in the Netherlands with 71,058 community-dwelling adults showed that increased income, both on a neighborhood and an individual level, were significantly associated with a lower prevalence of MDD. However, high SES was associated with a higher prevalence of MDD among African-American men in another study.29
SES is also a potential confounding factor, since it has been associated with other potential correlates of MDD, including poorer physical health and greater drug use. Some studies that adjusted for this potential confounder found that variables such as obesity or a chronic physical condition retained their significance after adjustment.35,43 However, Chen et al.44 found that smoking was a risk factor for MDD only in African-American participants, who presented a significantly lower mean income than their Caucasian counterparts. Some of these factors showed contradictory results depending on the study: although a low education level was associated with MDD in India, Mexico, and Australia, in China and the United States it appeared to be a protective factor. The full results can be seen in Table 2.
| Marital status | |||||||||
|---|---|---|---|---|---|---|---|---|---|
| Study | Country | Female | Separated | Divorced | Widowed | Single | Unemployed | SES | Education |
| Assari29 | United States | - | Married vs. other: 0.33 (0.12-0.91) | 1.61 (0.64-4.06) | 1.10 (1.00-1.20) | 12 years or more: 0.59 (0.28-1.23) | |||
| Bromet21 | Belgium | NS | 7.3 (1.8-29.7) | NS | NS | NS | - | NS | - |
| Brazil | 2.6 (1.9-3.5) | 1.6 (1.1-2.3) | 3.0 (1.9-4.9) | NS | NS | - | NS | - | |
| China | NS | 6.2* | NS | NS | - | Low vs. high: NSMedium-low vs. high: NS Medium-high vs. high: 0.5 (0.3-0.8) | - | ||
| Colombia | 1.9 (1.4-2.7) | NS | NS | NS | NS | - | NS | - | |
| France | 1.7 (1.2-2.5) | 6.2 (1.8-21.3) | NS | NS | 2.0 (1.2-3.5) | - | Low vs. high: 2.4 (1.2-4.6) | - | |
| Germany | 1.7 (1.0-3.0) | 3.1 (1.4-7.1)* | 2.3 (1.2-4.5) | 2.6 (1.6-4.2) | - | Low vs. high: 2.7 (1.3-5.6) | - | ||
| India | 1.9 (1.3-2.7) | 8.2 (2.2-30.6)* | 2.2 (1.5-3.2) | 0.3 (0.1-0.6) | - | Low vs. high: NSMedium-low vs. high: 2.1 (1.2-3.8)Medium-high vs. high: 2.0 (1.2-3.5) | - | ||
| Israel | 1.6 (1.2-2.1) | NS | 2.2 (1.5-3.4) | 2.1 (1.4-3.3) | NS | - | NS | - | |
| Italy | 2.5 (1.6-3.8) | 2.8 | NS | NS | NS | - | NS | - | |
| Japan | 2.3 (1.4-4.0) | 10.8 (2.1-55.6) | 5.1 (2.1-12.6) | NS | 3.1 (1.6-5.7) | - | NS | - | |
| Lebanon | 2.1 (1.3-3.4) | 19.3 (5.0-74.4) | NS | NS | NS | - | NS | - | |
| Mexico | 2.1 (1.5-2.9) | 1.9 (1.0-3.6) | NS | 2.7 (1.5-5.0) | NS | - | Low vs. high 2.1 (1.4-3.2) | - | |
| Netherlands | 2.3 (1.5-3.5) | 2.7* | NS | NS | - | NS | - | ||
| New Zealand | 1.7 (1.4-2.1) | 3.4 (2.4-4.8) | 2.8 (2.0-3.8) | NS | 2.3 (1.8-3.0) | - | Low vs. high: 2.2 (1.6-3.0)Medium-low vs. high: 1.5 (1.2-2.0) | - | |
| South Africa | 2.2 (1.5-3.2) | NS | 2.1 (1.3-3.5) | 2.3 (1.3-4.0) | 0.7 (0.5-1.0) | - | NS | - | |
| Spain | 2.7 (1.9-3.8) | 3.2 (1.3-7.7) | 3.3 (1.2-8.9) | NS | NS | - | NS | - | |
| Ukraine | 2.5 (2.0-3.0) | 6.6 (1.1-38.0) | 4.2 (2.9-6.2) | 8.0 (5.3-12.0) | NS | - | NS | - | |
| Chen44 | Taiwan | - | 2.87 (1.84-4.48)┼ | 3.34 (1.71-6.52) | - | Low vs. high: 2.18 (1.49-3.18) | Lowest education: 2.70 (1.51-4.83) | ||
| Chen30 | China | 1.6 (1.5-1.7) | - | - | - | - | - | - | - |
| Goldney22 | Australia | 1.4 (1.2-1.7) | 1.7 (1.4-2.0)╬ | 1.9 (1.5-2.2) | - | - | |||
| Gureje31 | Nigeria | NS | NS | - | - | - | - | NS | - |
| Hasin32 | United States | 2.0 (1.8-2.4) | 2.2 (1.9-2.6)╬ | - | Lowest vs. highest: OR: 1.7 | - | |||
| Kessler33 | United States | 1.7 (1.5-2.0) | 1.5 (1.2-1.8)┼ | 1.2 (1.0-1.4) | 1.5 (1.1-2.0) | NS | - | ||
| Kleinberg34 | Estonia | 1.8 (1.4-2.3) | 1.6 (1.1-2.2)* | 1.8 (1.3-2.4) | 1.5 (1.0-2.3) | 5.2 (2.8-9.4) | Lowest vs. highest: OR: 4.5 | - | |
| Klijs35 | Netherlands | 1.62 (1.46-1.79) | 1.9 (1.7-2.1)╬ | - | Individual income: 0.6 (0.6-0.7)Neighborhood income: 0.6 (0.6-0.7) | Lowest education: 6.0 (4.8-7.5) | |||
| Liu23 | China | 2.1 (1.5-2.8) | 2.3 (1.6- 3.4)┼ | 0.5 (0.2-0.9) | 3.7 (2.4-5.8) | Average vs. lowest: 0.3Highest vs. lowest: NS | - | ||
| Lu18 | China | NS | 1.6 (1.1- 4.2)┼ | NS | 2.4 (1.4-4.0) | - | - | ||
| Markkula28 | Finland | 2.3 (1.6-3.4) | 1.5 (1.2- 2.0)╬ | - | - | ||||
| Munhoz37 | Brazil | 2.4 (2.0-2.9) | 1.5 (1.1-1.9)┼ | 1.5 (1.2-2.0) | 1.2 (1.0-1.4) | - | - | ||
| Porras-Segovia39 | Spain | 1.9 (1.4-2.6) | - | - | - | - | |||
| Slone40 | Mexico | 1.8 (1.4-2.4) | 1.5 (1.0-2.1)╬ | - | - | - | |||
| Topuzoglu42 | Turkey | 2.7 (2.1-3.5) | NS | - | - | - | 2.7 (1.6-4.3) | NS | - |
Data presented as OR (95% confidence interval).
NS = non-significant; OR = odds ratio; SES = socioeconomic status.
* Separated and divorced are included in the same group.
┼ Separated, divorced, and widowed are included in the same group.
╬ Separated, divorced, widowed, and single are included in the same group.
Mental health-related correlates of major depressive disorder
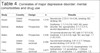
Importantly, MDD is also related to other mental illnesses. Its association with anxiety disorders, especially general anxiety disorder, is particularly strong. In two prospective studies, general anxiety disorder was also shown to be a consistent risk factor, doubling the probability of developing MDD,45,46 while an OR >8 was found between general anxiety disorder and MDD in a cross-sectional study.32 However, other studies found no significant association between the two conditions,47 while others found a strong association with different classes of phobia.48
The association between personality disorders and MDD was inconsistent and depended on the type of disorder. Although borderline and paranoid personality disorders were significantly associated with MDD in all of the studies that assessed them, other disorders, such as histrionic or evasive personality disorders, were associated with MDD in some but not all studies.32,49,50 Although one prospective study found no significant association between personality traits and MDD,8 in three other studies neuroticism was found to be a risk factor, while extroversion was a protective factor.51-53
Five studies found that tobacco use appeared to be related to MDD.44,52-55 Although some studies found an association between alcohol consumption and MDD,56 a large proportion of the studies did not.44,46,47,57 At low or moderate doses, alcohol consumption was even shown to be a protective factor.54,57
The most commonly studied risk factor was child abuse in its different forms (physical, psychological, and sexual), and nine studies found a significant association between it and MDD, although only certain subtypes of abuse were significant in some studies. In a Chinese retrospective study with 12,000 participants, those who claimed to have suffered childhood sexual abuse had a considerably higher prevalence of MDD, with an OR of 4.1.58 A prospective study followed U.S. children, beginning at the age of 11, for 28 years, finding that those who had suffered physical abuse had an OR of 1.6 for MDD compared to those who had not.59 This association may be mediated by genetic factors.60
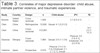
No relevant association between traumatic experiences and MDD was found in the few studies that explored the relationship.61 Nevertheless, in one study, a significant synergistic effect was found with child abuse: the strength of the association increased from an OR of 5.1, when only child abuse was present, to an OR of 12.4 when both child abuse and traumatic life experiences during adulthood were present.62 Other studies found that intimate partner violence63,64 or traumatic experiences30 increased the risk of MDD. Gender-based violence was also consistently associated with MDD. A prospective study in the UK followed 1,000 women over 10 years, and those who claimed to have suffered gender-based violence had twice the risk of developing MDD.65 The full results can be found in Tables 3 and 4.
| Study | Country | Design | n | Child abuse | IPV | TE |
|---|---|---|---|---|---|---|
| Bonomi63 | United States | Cross-sectional | 1,928 | - | 3.7 (2.6-4.1) | - |
| Chen58 | China | Retrospective | 12,000 | Sexual: 4.1 (3.2-5.2) | - | - |
| Chen30 | China | Cross-sectional | 512,891 | - | - | 14.7 (13.7-15.7) |
| Deyessa64 | Ethiopia | Cross-sectional | 1,994 | Sexual: 2.0 (1.1-3.6) | Physical: 2.6 (1.6-4.1); Emotional: 3.9 (2.2-6.9) | - |
| Gutiérrez60 | Spain | Prospective | 2,679 | Physical: 2.5 (1.9-3.3); Emotional: 2.1 (1.7-2.7); Sexual: 1.8 (1.1-3.0) | - | - |
| Kessler45 | United States | Prospective | 5,001 | Physical: 2.2 (1.8-2.7); Sexual: 1.8 (1.3-2.5) | - | - |
| Klijs35 | Netherlands | Cross-sectional | 71,058 | - | - | 1.18 (1.15-1.22) |
| Kounou49 | Togo | Retrospective | 181 | Physical: NS; Emotional: 3.7 (1.5-9.4); Sexual: 2.2 (1.0-4.8) | - | - |
| Ouellet-Morin65 | United Kingdom | Prospective | 978 | 1.9 (1.4-2.6) | 1.7 (1.1-2.8) | - |
| Power62 | United Kingdom | Retrospective | 455 | 5.1 (2.6-9.9); SLE: 12.4 (6.5-23.6) | - | NS |
| Schulz66 | Germany | Cross-sectional | 2,046 | Physical: 1.1 (1.1-1.2); Emotional: 1.1 (1.1-1.2); Sexual: 1.1 (1.1-1.2) | - | - |
| Spinhoven67 | Netherlands | Retrospective | 2,981 | Physical: 1.6; Emotional: 1.9;Sexual: 1.5 | - | - |
| Stegenga61 | United Kingdom | Prospective | 6,910 | - | - | 1: 2.4 (1.6-3.6); = 2: 4.0 (2.8-5.9) |
| Widom59 | United States | Prospective | 1,196 | Physical: 1.6 (1.0-2.5); Sexual: NS;Multiple: 1.8 (1.0-3.0) | - | - |
Data presented as odds ratio/hazard ratio (95% confidence interval).
IPV = intimate partner violence; NS = non-significant; SLE = stressful life events; TE = traumatic experiences.
| Study | Country | Design | n | Results |
|---|---|---|---|---|
| Assari51 | United States | Prospective | 1,219 | Neuroticism: 2.23 (1.14-4.34); smoking: NS; drinking: NS |
| Barkow47 | Multiple | Prospective | 729 | Dysthymia: 1.7 (1.0-2.9); GAD: NS; panic disorder: NS; agoraphobia: 2.7 (1.5-4.7); alcohol dependence: 2.0 (1.1-3.7) |
| Bellos57 | Multiple | Prospective | 5,438 | Occasional alcohol use: NS; light: 0.7 (0.5-0.9); moderate: 0.5 (0.4-0.8); high: NS; very high: 1.7 (1.05-2.67) |
| Chen44 | United States | Cross-sectional | 2,590 | Second-hand smoking: 2.97 (1.2-7.7)Heavy alcohol drinking: 0.91 (0.52-1.57) |
| Choy48 | United States | Cross-sectional | 5,877 | Any phobia: 1.9 (1.6-2.4); claustrophobia: 1.6; hydrophobia: 1.4; aerophobia: 1.3;blood phobia: 1.4; acrophobia: 1.7; zoophobia: 1.8; astraphobia: NS |
| Fergusson56 | New Zealand | Prospective | 1,265 | Alcohol abuse: 1.9 (1.5-2.4) |
| Hasin32 | United States | Cross-sectional | 43,093 | GAD: 8.6 (7.1-10.5); panic disorder: 5.4 (4.2-7.0); social phobia: 4.1 (3.4-5.1); specific phobia: 2.5 (2.1-3.0); any personality disorder: 3.6 (3.2-4.1); avoidant: 4.2 (3.4-5.2); dependent: 4.0 (2.6-6.1); antisocial: 2.5 (2.0-3.1); histrionic: 2.8 (2.1-3.7); paranoid: 3.7 (3.1-4.4); schizoid: 3.7 (3.0-4.5); obsessive: 2.6 (3.0-3.2); alcohol misuse: 1.3 (1.1-1.7); drug abuse: 2.2 (1.7-2.9); tobacco consumption: 2.2 (2.0-2.5) |
| Jylhä52 | Finland | Cross-sectional | 581 | Neuroticism: 1.1 (1.1-1.2); extroversion: 0.9 (0.9-1.0) |
| Kendler53 | Sweden | Prospective | 20,692 | Neuroticism: 1.3 (1.3-1.4); extroversion: 1.0 (0.9-1.0) |
| Kessler33 | United States | Cross-sectional | 9,090 | GAD: 3.2 (2.3-4.3); neuroticism: NS; extroversion: NS |
| Klijs35 | Netherlands | Cross-sectional | 71,058 | Tobacco consumption: 1.8 (1.6-2.00); heavy alcohol drinking: 1.17 (1.00-1.36) |
| Kounou49 | Togo | Retrospective | 181 | Antisocial personality disorder: NS; avoidant: NS; borderline: 5.6 (1.8-18.0); histrionic: NS; narcissistic: NS; obsessive: NS; paranoid: 3.3 (1.1-9.6); schizoid: 3.7 (1.3-10.8) |
| Mathew46 | United States | Prospective | 816 | Anxiety disorder: 2.3 (1.7-3.2); tobacco consumption: NS; alcohol: NS; others drugs: NS |
| Munhoz37 | Brazil | Cross-sectional | 2,925 | Alcohol misuse: 0.82 (0.70-0.97) |
| Meng & D'Arcy54 | Canada | Prospective | 12,227 | Tobacco consumption: 1.7 (1.2-1.6); alcohol, regular use: 0.8 (0.7-0.9) |
| Ohayon & Schatzberg55 | Multiple | Cross-sectional | 18,980 | Tobacco consumption: < 20 c/d: 1.3 (1.0-1.5); = 20 c/d: NS |
| Ouellet-Morin65 | United Kingdom | Prospective | 978 | Antisocial personality disorder: 2.4 (1.4-4.1); substance abuse: NS |
| Pasco68 | Australia | Retrospective | 974 | Tobacco consumption: 1.9 (1.0-3.7) |
| Reichborn-Kjennerud50 | Norway | Cross-sectional | 2,801 | Histrionic personality disorder: NS; borderline: 1.8 (1.6-2.0); paranoid: 1.1 (1.0-1.3); schizoid: NS; schizotypal: NS; avoidant: 1.1 (1.0-1.2); antisocial: NS; narcissistic: NS; dependent: NS; obsessive: NS |
Data presented as odds ratio/hazard ratio (95% confidence interval).
c/d = cigarettes/day; GAD = general anxiety disorder; NS = non-significant.
Physical health-related correlates
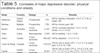
The majority of the reviewed studies showed a statistically significant association between physical conditions and MDD.31,54,55,69-73 Size effects typically increased with the number of chronic physical conditions suffered.54 A 16-year prospective study found that the presence of chronic illnesses increased the risk of MDD by 50%.54 In the Spanish population, a 2012 cross-sectional study of 2,121 community-dwelling adults found that MDD was significantly associated with chronic physical conditions and disability.72
With respect to specific conditions, larger effect sizes were found for back pain,55 cephalea,55,74 coronary disease,75 arthritis,71 asthma,76 diabetes,77 and stroke.75 The World Health Surveys, whose combined sample was 245,404 participants from 60 countries, showed a significant association between depression and four chronic diseases: angina, arthritis, asthma, and diabetes.78 In a 2008 study, several medical disorders, including gastric ulcer, allergic rhinitis, arthritis, thyroid disease, hypertension, and asthma, were found to be more prevalent in people with recurrent depressive disorders.79 Conversely, better health has been inversely associated with MDD, with an OR of 0.68 (0.61-0.75) in a recent study.43
Several studies also found an association between MDD and obesity.43,80-82 In a recent study of Spanish community-dwelling adults, body mass index (BMI) was directly associated with MDD prevalence after adjusting for age and sex (OR = 1.06; 95%CI 1.04-1.09; p < 0.001). In the same study, the BMI categories underweight (BMI < 18.5 kg/m2) and obese (BMI = 30 kg/m2) were also associated with a higher prevalence of MDD, independently of age or gender.43
However, stratification by gender often shows a stronger association between obesity and MDD among women, and in some cases the association disappears in men.80,81 In a 20-year U.S. prospective study, the relative risk of MDD in obese women was 3.9, while no significant association was found in men.80 A 2018 study investigated whether depression was associated with higher BMI, as well as with a genetic risk score involving 73 obesity-related polymorphisms. The authors found a significant association between depression and both variables, which was stronger in women than in men.81 The association between MDD and physical health factors is presented in Table 5.
| Study | Country | Design | n | Results |
|---|---|---|---|---|
| Anderson80 | United States | Prospective | 776 | HR for obesity in females: 3.9 (1.3-11.8); in males: NS |
| Barkow47 | Multiple | Prospective | 729 | HR for chronic pain: NS |
| Baune75 | Australia | Cross-sectional | 4,181 | OR for coronary disease: 1.6 (1.1-2.3); stroke: 2.3 (1.3-4.0) |
| Chen76 | China | Retrospective | 7,265 | HR for asthma: 1.8 (1.1-2.9) |
| Chien77 | Taiwan | Cross-sectional | 766,427 | OR for diabetes: 1.5 (1.4-1.7) |
| Currie & Wang69 | Canada | Cross-sectional | 118,533 | OR for one or more CPC: 1.3 (1.3-1.3); back pain: 6.2 (5.16-7.58) |
| Egede70 | United States | Cross-sectional | 30,801 | OR for one or more CPCs: 2.6 (2.3-2.9); one CPC: 2.2 (2.0-2.5); two CPCs: 3.9 (3.2-4.8); three or more CPCs: 6.5 (5.2-8.2) |
| Gabilondo72 | Spain | Cross-sectional | 5,473 | OR for one CPC: NS; two CPCs: NS; three or more CPCs: 4.0 (2.7-5.9); disability: (2.1-6.3); cancer: NS; chronic pain: 2.1 (1.5-3.0); respiratory diseases 2.5 (1.7-3.7); ulcer: NS; CV disease: 1.8 (1.2-2.8); diabetes: NS |
| Gureje31 | Nigeria | Cross-sectional | 6,752 | OR for ulcer: 5.2 (2.0-13.3); musculoskeletal disease: 2.6 (1.4-4.8); chronic pain: 2.5 (1.4-4.7) |
| Klijs35 | Netherlands | Cross-sectional | 71,058 | OR for one CPC: 1.9 (1.6-2.2); two or more CPCs: 2.2 (2.0-2.5); underweight: 2.0 (1.3-3.0); overweight: NS; obesity: 1.5 (1.3-1.8) |
| Kounou49 | Togo | Retrospective | 181 | HR for one or more CPCs: 2.6 (1.1-6.2) |
| Mather83 | Canada | Cross-sectional | 36,984 | OR for one or more CPCs: 1.4 (1.2-1.6) |
| Meng & D'Arcy54 | Canada | Prospective | 12,227 | HR for one or more CPCs: 1.5 (1.3-1.6) |
| Modgill74 | Canada | Retrospective | 15,254 | OR for migraine: 1.6 (1.3-1.9) |
| Ohayon & Schatzberg55 | Multiple | Cross-sectional | 18,980 | OR for one or more CPCs: 2.2 (1.8-2.8); chronic pain: 3.6 (2.9-4.4); one or more CPC + pain: 5.2 (4.0-6.8); overweight (BMI 25-27): 0.7 (0.6-0.9); obesity: NS |
| Porras-Segovia43 | Spain | Cross-sectional | 4,507 | OR for increases in BMI: 1.1 (1.1-1.1); underweight: 2.1 (1.1-4.1); overweight: NS; obesity: 2.4 (1.8-3.3) |
| Stegmann71 | Multiple | Cross-sectional | 8,796 | OR for one CPC: 1.5 (1.2-1.9); two: 2.0 (1.5-2.8); three: 3.5 (2.2-5.5); four or more CPCs: 5.6 (2.9-11.0); arthritis: 2.3 (1.8-2.8); allergic: 1.3 (1.0-1.7); CV disease: 2.2 (1.5-3.2); hypertension: NS; asthma: NS; diabetes: NS; ulcer: 2.0 (1.4-2.8) |
| Tyrrell81 | United States | Retrospective | 340,786 | OR for increases in genetically determined BMI: 1.2 (1.1-1.3) |
Data presented as OR/HR (95% confidence interval).
BMI = body mass index; CPC = chronic physical condition; CV = cardiovascular; HR = hazard ratio; NS = non-significant; OR = odds ratio.
DISCUSSION
Most studies on the epidemiology of MDD have been conducted in Western countries, while data from developing countries is comparatively scarce. Cross-sectional studies are also more numerous than longitudinal ones, which is probably a result of the higher costs associated with the latter.84
Prevalence of major depressive disorder
The results show that MDD is a highly prevalent condition worldwide, and there is no evidence of a substantial change in the prevalence of MDD over the past few decades.6,7 Interregional differences in the prevalence of MDD are notable. The low prevalence found in Asian countries is remarkable, especially compared to the figures found in Western countries. However, it does not necessarily follow that the inhabitants of countries with a low prevalence of depression suffer less or are happier, given that Asian countries have some of the highest suicides rates in the world.85
Pérez-Sales'86 work on anthropological psychology indicated that the pathoplasticity of mental disorders was the main cause for this disparity: the same condition may have different forms of clinical expression depending on the cultural context. For instance, it is believed that somatization is more frequent in non-Western populations, since the separation between body and mind is not as culturally established. In China, where the prevalence of depression is strikingly low, neurasthenia is, in contrast, very prevalent. Neurasthenia, which is scarcely known in the West, consists of extreme fatigue, muscle aches, and unspecified somatic discomfort. It has been suggested that this condition could be analogous to depression in some Eastern countries.86
While the DSM-IV was in development, a workgroup was tasked with resolving the problems of applying Western diagnostic categories to non-Western populations. Despite the workgroup's efforts, many authors question the intercultural validity of this and similar diagnostic classifications.86,87 We must also consider the limitations of the diagnostic tools commonly employed in research, which were originally designed for Western populations and may not be ideal in other settings, even after translation and validation.88,89 Finally, the possibility of genetic susceptibility to depression in certain populations cannot be ruled out.90 These interregional differences may result in both underestimation and/or overestimation of MDD, depending on the country.
Sociodemographic factors
Our results confirm the association between MDD and some sociodemographic factors classically associated with this and other depressive disorders. Female sex was the sociodemographic factor most consistently associated with MDD. In his review on the subject, Kessler91 states that although women have a higher risk of developing depression, there are no significant differences in the clinical course of the condition, with similar persistence and recurrence rates. A synergic effect between biological and environmental factors underlies this association.91 Some of these factors are hormonal profiles and social inequality. Additionally, the open expression of sadness in males is sometimes frowned upon, which can affect the validity of the scales.92-94 Some authors have also found gender differences in the expression of the serotonin transporter polymorphisms associated with depression,95 as well as in the cellular immunity response to stress and depression.96 It has even been suggested that there could be gender-related subtypes of depression.97
SES is another factor associated with MDD. Since 1980, a number of studies have found an inverse association between SES and psychiatric disorders, including depressive disorders.98 However, in our review, SES was not consistently associated with MDD, revealing contradictory results depending on the country. The effects of educational level were similar. For a proper assessment of these large interregional differences, we should consider that having a low salary or education level may not have the same effect on subjective well-being across cultures.99 For instance, high SES increased the risk of MDD in African-American males. Perceived discrimination has been proposed as a potential mediator for increased MDD risk in African-American men with high-SES. However, a study examining the role of this variable failed to confirm this effect.29 Finally, some factors significantly associated with MDD, such as marital status and unemployment, might have a two-way relationship with MDD.
Physical and mental comorbidities of MDD
MDD is associated with poorer physical health, including high comorbidity with chronic physical conditions and higher rates of disability. There are multiple mechanisms by which physical conditions can predispose individuals to MDD. The traumatic experience of illness and the dysfunction that comes with it can trigger a depressive episode.100 Biological factors can also be involved: modified inflammatory pathways and immune system changes have been implicated in the pathogenesis of depression,101 and depression has a pro-inflammatory effect. This could result in a two-way relationship between depression and physical condition.102
In obesity, a key element appears to be distorted body image and resultant loss of self-esteem. The association between MDD and obesity may also be explained by increased circulation of pro-inflammatory cytokines and C-reactive protein, a finding of some review articles.103,104 The association between MDD and obesity was gender-dependent, with greater effect sizes in women and, in some cases, non-significant results in men. This could be the result of different body weight standards for men and women, i.e., due to cultural influences, women tend to be more susceptible to weight stigma than men.105
Comorbidity with mental disorders is another important factor. There is a strong, often two-way, relationship between MDD and other mental conditions. Patients with MDD may develop other mental comorbidities over the course of the disorder, while MDD may also appear during the course of other conditions, such as anxiety disorders.106 Furthermore, as with physical conditions, mental illness is a traumatic experience that could trigger a depressive episode. Finally, different mental disorders can share certain pathogenic mechanisms.107,108
Personality traits can increase the risk of a depressive episode, and social interaction may also mediate this association. Positive social interaction enables the creation of strong bonds and the development of a solid support network. Furthermore, personality can influence coping strategies and the ability to overcome adversity.109
Tobacco use may also be a risk marker since people with symptoms of depression and anxiety tend to smoke more. In addition, oxidative stress induced by tobacco may contribute to the development of depression.110 On the other hand, the effectiveness of bupropion for treating both depression and nicotine addiction suggests that both pathologies could share some neurochemical characteristics.68
The relationship between alcohol and MDD is ambiguous. The causes and consequences of low to moderate alcohol consumption are radically different than those of alcohol abuse, which is not the case with other drugs. The fact that limited alcohol consumption may protect against depression can be explained by social factors. In Western countries, where alcohol is widely distributed and socially accepted, average use may imply good social adjustment to some extent.111,112
The traumatic experience most strongly associated with MDD was child abuse, which can predispose to the development of depression during adulthood in various ways. One of the best-known theories is that of learned helplessness: people who repeatedly suffer negative stimuli beyond their control may lose the ability to cope with future hardships.113 This could explain why, in our review, stressful life events were not significantly associated with depression when considered alone, but were associated with it when combined with child abuse. Thus, they may have a synergic effect, increasing the risk of depression in those who suffered abuse during childhood.
Finally, some limitations should be addressed. Since most of the included studies were cross-sectional, causal relationships could not be established. The risk factor studies had heterogeneous methodologies, which impedes comparison of the results. Additionally, in retrospective studies there may be a recall bias regarding traumatic experiences.
CONCLUSION
In conclusion, the present review has grouped the most important recent findings worldwide about the prevalence and correlates of MDD, offering a broad overview of the current situation. Despite the heterogeneity of the studies, we were able to reach some strong conclusions. First, MDD is a prevalent condition worldwide. Second, the fact that several correlates were consistently associated with MDD has implications for health-care planning. Third, we found relevant cross-cultural differences, which makes us question whether standard diagnostic classifications and measurement tools are appropriate for non-Western cultures.
Three main issues should be considered in future research: 1) the methodological heterogeneity of epidemiological studies; 2) the lack of studies from developing countries, especially in Africa; and 3) the cultural idiosyncrasies of each country, which affect the validity of our measurements and even the concept of depression.
ACKNOWLEDGEMENTS
This study received grant support from Instituto de Salud Carlos III (ISCIII CM19/00026).
The authors wish to thank Ella Martin for translating the article into English.
Disclosure
The authors report no conflict of interest.
 PDF
 Print
 Send this article by email
 How to cite this article
 Submit a comment
 Mendeley
 Pocket
 Share on Facebook
 Share on Twitter