


ABSTRACT:
OBJECTIVE: Social cognition skills, such as emotional processing, empathy, and mental state attribution,
are critical for regulating behavior and decision-making, including alcohol consumption.
However, there is no consensus on whether cognitive deficits are a risk factor for
or a consequence of alcohol use disorders. Most studies on this issue have been conducted
with people aged = 40 years with a long drinking history. This study investigated
the associations between social cognition skills and Alcohol Use Disorders Identification
Test (AUDIT) scores in young adults and considered the influence of the onset of alcohol
and drinking patterns.
METHODS: A total of 112 volunteers aged 18-25 years completed AUDIT and online questionnaires
about their drinking history and sociodemographic characteristics. Participants completed
online tasks to assess facial emotion recognition, empathic abilities, and theory
of mind.
RESULTS: A significant negative association was found between AUDIT scores and facial emotion
recognition performance (p = 0.040). Path analysis revealed that earlier onset of
alcohol use was associated with higher AUDIT scores (p < 0.001), which predicted poorer
performance on facial emotion recognition tasks (p = 0.010).
CONCLUSIONS: These findings support the hypothesis that higher AUDIT scores and early onset of
consumption are associated with lower accuracy in recognizing facial emotions among
young adults.
Keywords: Alcohol use disorders; social cognition; facial emotion recognition; empathy; theory of mind; socioeconomic factors.
FIGURES
| Note: How to cite this article: Petucco G, Mello CB, Souza-Formigoni MLO. Is facial emotion recognition deficit a predictor of risky alcohol use in young adults? Braz J Psychiatry. 2026;48:e20254448. Epub 2025 Dec 8. http://doi.org/10.47626/1516-4446-2025-4448 |
| Received: July 21 2025; Accepted: November 25 2025 |
INTRODUCTION
Alcohol use typically begins early and is highly prevalent among youth,1 being socially encouraged and influenced by behavioral effects such as disinhibition and anxiety reduction.2,3 Young individuals' perceptions of peer drinking behaviors and the value attributed to alcohol's effects warrant further investigation, as these perceptions significantly influence decision-making.4 These perceptions may be shaped by social cognition (SC) skills, which include facial emotion recognition, empathy, and theory of mind.5 Empathy refers to the ability to identify emotions in others (e.g., through facial expressions) and mirror these emotions internally, adopting the other's perspective and responding appropriately.6 Theory of mind, or mentalization, is the capacity to attribute mental states, such as thoughts, beliefs, desires, emotions, or intentions, to others based on prior knowledge or shared social context.7 Accurate interpretation of emotional cues and peer-conveyed information facilitates social integration and engagement in interpersonal activities, including those involving drinking.
Alcohol consumption patterns are modulated by varying social contexts and norms.8 Among youth, nonconformity to social norms may lead to more frequent or excessive drinking, potentially due to social disengagement or misinterpretation of context.9 Inadequate social responses may result in interpersonal conflict and reduced social interaction, thereby increasing stress and social isolation.10 Alcohol may be used to cope with the negative emotions arising from such situations. Its perceived facilitative effects on social interaction may promote increased consumption, particularly among individuals with lower social competence.11 Given that peer influence plays a significant role in youth alcohol use,3,9 alcohol may serve as a means of fostering social bonds and enhancing feelings of acceptance.
Chronic, high-level alcohol use over extended periods leads to substantial behavioral and cognitive impairments, including SC deficits.12-17 However, most studies examining the relationship between SC and alcohol use have focused on individuals aged = 35 years with long-term drinking histories.12,18 Two primary hypotheses have been proposed: either alcohol use contributes to SC deficits, or pre-existing SC impairments increase vulnerability to problem drinking.
Few studies have explored the association between SC and alcohol use in young individuals, who are less likely to have cognitive impairment due to chronic alcohol exposure. Our main objective was to determine whether SC skills influence or are influenced by alcohol consumption patterns. We also assessed the associations between SC domains and alcohol-related problems, considering the influence of gender and age at the onset of alcohol consumption. Another objective was to examine whether SC abilities predict risky alcohol use, accounting for sociodemographic variables. We hypothesized that pre-existing SC deficits would be associated with higher levels of alcohol use, greater alcohol-related problems, and earlier onset of drinking.
METHODS
Participants
This cross-sectional study included 112 adults aged 18-25 years, self-identifying as male (n=28), female (n=84), or other gender (n=0), recruited through posts on social media platforms, university websites, and bulletin boards. The exclusion criteria were: high-risk or potentially dependent use of substances other than alcohol, and self-reported diagnosis of psychiatric or neurodevelopmental disorders (particularly autism spectrum disorder and conditions associated with alexithymia), or uncorrected motor or sensory impairments.
Procedures
Data were collected online in two sessions, spaced at least 1 week apart. In the first session, participants completed Google Forms assessing sociodemographic characteristics, alcohol use history, and alcohol-related problems using the Alcohol Use Disorders Identification Test (AUDIT). A pilot assessment was initially conducted to determine how the second session's test would be applied. Ten of the 21 volunteers who answered the first session's questionnaires participated in a video call, of whom seven participated in a group session and three participated individually. During the call, they completed the tests in the presence of the researcher, who was available to answer questions about the instructions on the screen while they took the test. The other eleven volunteers performed the tests in complete isolation using a link sent by email, which provided access to the same instructions as the previous group. Since the internal consistency indices (Cronbach's a) of the groups that participated in a video call session (a = 0.743) and those who did not (a = 0.786) were considered good and similar, the remaining participants filled out the forms individually using a link sent by email. The order of task presentation was alternated to minimize fatigue-related bias. The start and end times of the second session were recorded to calculate the "time spent on tasks" variable, including completing the Alcohol, Smoking and Substance Involvement Screening Test and performing the set of cognitive tasks.
Instruments
Alcohol Use Disorders Identification Test
This 10-item questionnaire assesses alcohol use and related problems over the past 12 months. We used an adapted online form of the Brazilian version of AUDIT, which was translated by Mendez19 and validated by Lima et al.,20 available at: https://www.supera.org.br/wp-content/uploads/2021/04/Bloco_Audit.pdf. Based on AUDIT scores, participants were classified as low-risk (0-7) or risky/suggestive of dependence (8-40).19,20
Brazilian Economic Classification Criteria
Socioeconomic status was determined based on household consumer goods, the education level of the head of the household, and the quality of the utilities, being categorized as follows (mean monthly household income in parentheses): A (USD 4,439 or more), B1 (USD 2,038-1,066), B2 (USD 1,065-596), C1 (USD 595-353), C2 (USD 352-158), and D/E (USD 159 or less).21
Alcohol, Smoking, and Substance Involvement Screening Test
This 8-item questionnaire assesses lifetime and recent (past 3 months) use of 10 substance classes and associated consequences. Individuals whose scores indicated risky or dependent use of substances other than alcohol were excluded.22,23
Interpersonal Reactivity Index
This 21-item scale measures cognitive and affective components of empathy, including empathic concern, perspective-taking, and personal distress. The Brazilian version (Escala Multidimensional de Reatividade Interpessoal de Davis) excludes the fantasy subscale due to cultural incompatibility.24 Higher scores reflect greater empathy across subscales.25
Reading the Mind in the Eyes Test
This test comprises 37 grayscale images of the eye region used to determine recognition of mental states (e.g., sarcastic, relaxed, joking, interested). Participants select one of four options per image. Scores are based on correct responses, ranging from 0 to 37.26,27
Basic and complex facial emotion recognition tasks
The basic emotion recognition task included 14 color photographs of the faces of people varying in sex and age, depicting basic emotions (happy, sad, angry, surprised, fearful, disgusted), and a neutral expression. Each stimulus was shown individually for 5 seconds, followed by a black screen. The respondent was then asked to identify the emotion among seven alternatives presented at the bottom of the screen, with no time limit. The complex emotion recognition task consisted of six video clips showing faces of people of different ages, sexes, and races expressing complex emotions or mental states (e.g., restlessness, embarrassment, unfriendliness, boredom, indecision, nervousness). Four response alternatives were presented after each video, following the same procedures as the basic emotions test. The stimuli were drawn from the Karolinska Directed Emotional Faces database28 and the Cambridge Mindreading Face-Voice Battery for Children.29 Stimulus selection was based on data from a prior study30 with Brazilian adults, focusing on items that best differentiated individuals with and without social cognitive deficits. For both tasks, accuracy was the primary measure.
Statistical analysis
Sample size calculations for the generalized linear model analyses were conducted using G*Power 3.1.9.7 for each dependent variable, with a significance level of 5% and statistical power of 80%. The largest minimum sample size required across models was selected. Given the final sample of 112 participants, the statistical power ranged from 64% to 82%. Based on AUDIT scores, participants were classified as low-risk alcohol use (AUDIT < 8 - Group 1) or "risky/suggestive of dependence alcohol use" (AUDIT > 7 - Group 2). To compare groups in relation to sociodemographic, alcohol use history, and SC test results, Student's t-test or the chi-square test was applied, depending on the variable's characteristics. Only variables significantly associated with AUDIT scores or SC test results in the univariate analyses were incorporated into the generalized linear model and structural equation modeling. The first generalized linear model tested the association between AUDIT scores and the variables: gender, age at onset of alcohol use, scores on the SC tasks (facial emotion recognition task, the Interpersonal Reactivity Index, Reading the Mind in the Eyes Test, and time spent on tasks). Due to the non-normal distribution of AUDIT scores, a generalized linear model with an identity link function and gamma distribution was used, with a constant added to each value to correct for very small scores. In the second generalized linear model, we examined whether the variables from the first model predicted group classification as low-risk or high-risk, using a generalized linear model with a logistic link function and binomial distribution. Additionally, structural equation modeling with path analysis was conducted to assess whether SC task scores influenced alcohol-related problems or whether alcohol consumption affected SC task performance. All analyses were performed in JAMOVI.31-33
Ethics statement
This study was approved by the Universidade Federal de São Paulo/Hospital São Paulo research ethics committee (certificate 42124621.8.0000.5505, document 5.282.174). Participants received detailed information regarding the study's objectives, data confidentiality, and experimental procedures before providing informed consent electronically. A copy of the signed consent form was emailed to participants, along with a report of their test results and a PDF guide containing information on the consequences of substance use. Participants in whom risky use was detected also received a list of public health services where they could seek assistance.
RESULTS
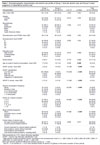
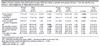
The participants' sociodemographic characteristics and alcohol use profiles, stratified by alcohol use risk level, are presented in Table 1. Table 2 shows their SC task performance.
| Characteristics | Group 1n=69 (61.6%) | Group 2n=43 (38.4%) | t (or ?2) | p-value | Totaln=112 (100.0%) |
|---|---|---|---|---|---|
| Age, mean (SD) | 22.1 (2.3) | 22.3 (2.2) | -0.06 | 0.95 | 22 (2.3) |
| Gender | |||||
| Female | 53 (76.8) | 31 (72.1) | 0.315 | 0.58 | 84 (75.0) |
| Male | 16 (23.2) | 12 (27.9) | 28 (25.0) | ||
| Race/ethnicity | |||||
| White | 47 (68.1) | 28 (65.1) | 1.940 | 0.75 | 75 (67.0) |
| Multiracial | 13 (18.8) | 10 (23.2) | 23 (20.5) | ||
| Black | 5 (7.2) | 1 (2.3) | 6 (5.4) | ||
| Asian | 3 (4.3) | 3 (7.0) | 6 (5.4) | ||
| South American Indian | 1 (1.4) | 1 (2.3) | 2 (1.8) | ||
| Socioeconomic level CCEB, mean (SD) | 40 (11.8) | 39 (12.2) | 0.528 | 0.60 | 40 (12.9) |
| Socioeconomic level CCEB* | |||||
| A | 24 (34.8) | 13 (30.2) | 3.350 | 0.50 | 37 (33.0) |
| B1 | 16 (23.2) | 6 (13.9) | 22 (19.6) | ||
| B2 | 17 (24.6) | 16 (37.2) | 33 (29.5) | ||
| C1 | 7 (10.1) | 6 (13.9) | 13 (11.6) | ||
| C2 | 5 (7.2) | 2 (4.6) | 7 (6.3) | ||
| Education level | |||||
| High school | 24 (34.8) | 16 (37.2) | 0.075 | 0.963 | 40 (35.7) |
| Undergraduate | 38 (55.1) | 23 (53.5) | 61 (54.5) | ||
| Graduate | 7 (10.1) | 4 (9.3) | 11 (9.8) | ||
| School failure | 6 (8.7) | 6 (13.9) | 0.776 | 0.382 | 12 (11.4) |
| Age at onset of alcohol consumption, mean (SD) | 17 (2.2) | 15 (1.9) | 3.230 | 0.002 | 16 (2.2) |
| AUDIT scores, mean (SD) | 3 (2.2) | 14 (5.4) | -12.100 | < 0.001 | 7 (6.4) |
| AUDIT classification | |||||
| Low-risk use | 69 (100.0) | 0 (0.0) | 112.000 | < 0.001 | 69 (61.6) |
| Risk use | 0 (0.0) | 30 (69.8) | 30 (26.8) | ||
| High-risk use | 0 (0.0) | 7 (16.3) | 7 (6.3) | ||
| Suggestive of dependence | 0 (0.0) | 6 (13.9) | 6 (5.4) | ||
| AUDIT-C scores, mean (SD) | 2 (1.5) | 6 (1.9) | -11.200 | < 0.001 | 4 (2.4) |
| Alcohol consumption frequency | |||||
| Never | 10 (14.5) | 0 (0.0) | 25.200 | < 0.001 | 10 (8.9) |
| Monthly or less | 31 (44.9) | 10 (23.2) | 41 (36.6) | ||
| 2 to 4 times/month | 25 (36.2) | 18 (41.9) | 43 (38.4) | ||
| 2 to 3 times/week | 3 (4.3) | 15 (34.9) | 18 (16.1) | ||
| = 4 times/week | 0 (0.0) | 0 (0.0) | 0 (0.0) | ||
| Drinks on a typical occasion | |||||
| 1 or 2 | 27 (39.1) | 3 (6.9) | 52.600 | < 0.001 | 30 (28.6) |
| 3 or 4 | 28 (40.6) | 6 (13.9) | 34 (32.4) | ||
| 5 or 6 | 7 (10.1) | 18 (41.9) | 25 (23.8) | ||
| 7, 8, or 9 | 0 (0.0) | 9 (20.9) | 9 (8.6) | ||
| = 10 | 0 (0.0) | 7 (16.3) | 7 (6.7) | ||
| Binge drinking frequency┼ | |||||
| Never | 29 (42.0) | 2 (4.6) | 47.600 | < 0.001 | 31 (29.8) |
| Less than once a month | 30 (43.5) | 15 (34.9) | 45 (43.3) | ||
| Monthly | 2 (2.9) | 20 (46.5) | 22 (21.2) | ||
| Weekly | 0 (0.0) | 6 (13.9) | 6 (5.8) | ||
| Family history of alcohol use | |||||
| No report of alcohol problems | 26 (37.7) | 12 (27.9) | 3.580 | 0.611 | 38 (33.9) |
| Current alcohol-related problems | 21 (30.4) | 17 (39.5) | 38 (33.9) | ||
| Current treatment for alcohol-related problems | 1 (1.4) | 1 (2.3) | 2 (1.8) | ||
| Past problems solved without treatment | 13 (18.8) | 5 (11.6) | 18 (16.1) | ||
| Past problems and treatment | 5 (7.2) | 6 (13.9) | 11 (9.8) | ||
| Past alcohol-related problems, including death | 3 (4.3) | 2 (4.6) | 5 (4.5) |
Data presented as n (%), unless otherwise specified.
AUDIT = Alcohol Use Disorders Identification Test.
* Approximate monthly household income, according to the socioeconomic level: A (= USD 4,439), B1 (USD 2,038), B2 (USD 1,065), C1 (USD 595), C2 (USD 352.82), or D/E (= USD 159).
Bold type denotes significant differences between groups (p < 0.05).
┼ Use of = 5 (in women) or = 6 (in men) standard doses of alcohol (10 g/dose) on the same occasion (2-hour period).
| Female n=84 (75.0%) | Male n=28 (25.0%) | t | p-value | Group 1n=69 (61.6%) | Group 2n=43 (38.5%) | t | p-value | Totaln=112 (100.0%) | |
|---|---|---|---|---|---|---|---|---|---|
| Facial emotion recognition | 17.4 (1.6) | 17.6 (1.1) | 0.753 | 0.454 | 17.9 (1.3) | 16.8 (1.6)┼ | 3.76 | < 0.001 | 17.5 (1.5) |
| Facial basic emotion recognition | 11.8 (1.3) | 11.9 (1.0) | 0.0875 | 0.930 | 12.2 (1.1) | 11.3 (1.2)┼ | 3.64 | < 0.001 | 11.8 (1.2) |
| Facial complex emotion recognition | 5.6 (0.7) | 5.7 (0.4) | 1.62 | 0.110 | 5.7 (0.6) | 5.5 (0.7) | 1.68 | 0.085 | 5.6 (0.6) |
| IRI | 75.7 (9.2) | 69.8 (9.9)╬ | -2.88 | 0.005 | 75.6 (9.3) | 72.0 (9.9) | 1.94 | 0.055 | 74.2 (9.7) |
| IRI empathic concern | 28.2 (4.4) | 24.4 (4.1)╬ | -3.94 | < 0.001 | 27.5 (4.3) | 26.7 (5.1) | 0.922 | 0.358 | 27.2 (4.6) |
| IRI perspective-taking | 25.3 (5.1) | 25.4 (5.5) | 0.126 | 0.900 | 25.8 (4.6) | 24.5 (5.9) | 1.27 | 0.205 | 25.3 (5.2) |
| IRI personal distress | 22.3 (4.4) | 20.0 (4.2)╬ | -2.41 | 0.018 | 22.3 (4.3) | 20.8 (4.6) | 1.74 | 0.085 | 21.7 (4.5) |
| RMET | 27.9 (3.2) | 26.6 (4.3) | -1.64 | 0.105 | 28.0 (3.6) | 26.9 (3.4) | 1.50 | 0.137 | 27.6 (3.6) |
| Time spent on tasks (minutes) | 28.7 (10.6) | 28.6 (15.4) | -0.0312 | 0.975 | 27.4 (9.3) | 30.7 (14.9) | -1.39 | 0.166 | 28.7 (11.8) |
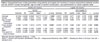
In the first generalized linear model, we identified a significant negative association between facial emotion recognition and AUDIT scores (ß = -0.7831; z = -2.081; p = 0.040): fewer correct responses were associated with higher AUDIT scores. Additionally, age at onset of alcohol use was negatively associated with AUDIT scores (ß = -1.0434; z = -3.911; p < 0.001), indicating that earlier initiation of alcohol consumption is linked to greater alcohol-related problems in early adulthood. The second generalized linear model revealed that better performance on the facial emotion recognition task was associated with increased odds of belonging to the low-risk alcohol use group (odds ratio = 0.589 [0.402-0.818]; p = 0.003). Longer time spent on SC tasks was also associated with higher odds of being in the risky/suggestive of dependence group (odds ratio = 1.052 [1.011-1.102]; p = 0.018). Furthermore, later onset of alcohol use was associated with greater odds of belonging to the low-risk group (odds ratio = 0.668 [0.510-0.849]; p = 0.002). No significant associations were found between performance on the other SC tasks and group classification. Results from both models are presented in Table 3.
| Identity link function | Logistic link function | ||||||||||||
|---|---|---|---|---|---|---|---|---|---|---|---|---|---|
| 95%CI | 95% Exp(B) CI | ||||||||||||
| Estimate | SE | Lower | Upper | z | p-value | Estimate | SE | exp(B) | Lower | Upper | z | p-value | |
| Intercept | 18.1094 | 0.6558 | 16.8947 | 19.4717 | 27.612 | < 0.001 | -0.5611 | 0.2803 | 0.571 | 0.323 | 0.978 | -2.002 | 0.045 |
| Gender | -0.8954 | 1.3054 | -3.6181 | 1.6131 | -0.686 | 0.494 | -0.2472 | 0.5743 | 0.781 | 0.251 | 2.439 | -0.430 | 0.667 |
| Age at onset of alcohol consumption | -1.0434 | 0.2668 | -1.5668 | -0.5197 | -3.911 | < 0.001 | -0.4028 | 0.1288 | 0.668 | 0.510 | 0.849 | -3.127 | 0.002 |
| Facial emotion recognition | -0.7831 | 0.3763 | -1.5419 | -0.0701 | -2.081 | 0.040 | -0.5291 | 0.1787 | 0.589 | 0.402 | 0.818 | -2.962 | 0.003 |
| IRI | -0.0681 | 0.0584 | -0.1927 | 0.0559 | -1.164 | 0.247 | -0.0410 | 0.0250 | 0.960 | 0.912 | 1.007 | -1.642 | 0.101 |
| RMET | 0.1073 | 0.1550 | -0.2160 | 0.3974 | 0.692 | 0.490 | -0.0235 | 0.0665 | 0.977 | 0.854 | 1.115 | -0.354 | 0.724 |
| Time spent on tasks (minutes) | 0.0516 | 0.0455 | -0.0287 | 0.1425 | 1.133 | 0.260 | 0.0511 | 0.0216 | 1.052 | 1.011 | 1.102 | 2.366 | 0.018 |
Bold type denotes significant results (p < 0.05).
AUDIT = Alcohol Use Disorders Identification Test; IRI = Interpersonal Reactivity Index; RMET = Reading the Mind in the Eyes Test; SE = standard error.
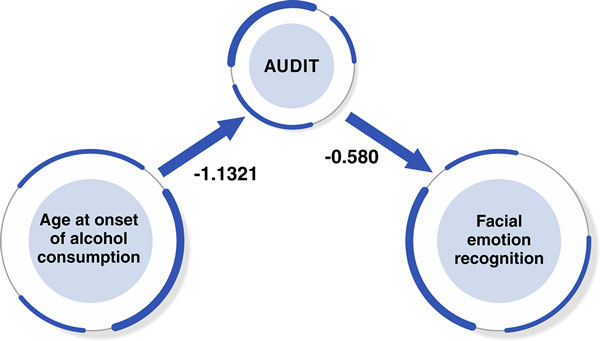
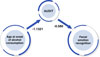
Structural equation modeling was conducted using two models. In the first, SC measures were independent variables, and AUDIT scores and age at onset of alcohol use were dependent variables. Facial emotion recognition had a significant negative influence on alcohol use indicators, suggesting that impaired SC could lead to problematic alcohol use. In the second model, alcohol use measures were independent variables, and SC measures were dependent variables. Given the established association between early alcohol initiation and future alcohol-related problems,34,35 this relationship was retained in both models. Initially, all variables were included; non-significant paths were removed iteratively to optimize model fit based on Akaike information criterion, Bayesian information criterion, and root mean square error of approximation values. The model with the best fit is presented in Figure 1, indicating that each additional year in age at the onset of alcohol use was associated with a 1.13-point decrease in AUDIT scores (p < .001). Moreover, each additional AUDIT point was associated with a 0.058-point decrease in the number of correct facial emotion recognition task responses (p = 0.010). These findings suggest that AUDIT scores play a potential mediating role in the relationship between age at onset of alcohol use and facial emotion recognition performance. However, as no significant direct association was found between age at onset and facial emotion recognition, formal mediation or moderation analyses could not be conducted.
DISCUSSION
In this study, we investigated the associations between alcohol-related problems and SC skills in young adults. By focusing on individuals aged 18 to 25 years, we aimed to assess SC performance prior to any long-term effects of chronic alcohol use. This age range distinguishes our study from most previous research, which has mainly examined middle-aged individuals with extended drinking histories.18,12
Our findings contribute to existing evidence suggesting that early alcohol use may rapidly impair sociocognitive development34-36 and help clarify inconsistencies in the literature.37 Contrary to our initial hypothesis, our data indicate that early and heavy alcohol use contributes to poorer performance in the facial emotion recognition task. We accept this alternative hypothesis because the results of the statistical analyses were more robust than those obtained when we tested the opposite hypothesis. Nevertheless, in the first structural equation model, we also found that facial emotion recognition had a significant negative influence on alcohol use indicators. Thus, depending on the study design and the analyses performed, different conclusions can be reached. Cohort studies could help clarify the temporal aspects of this relationship.
Although no direct association was found between age at onset of alcohol consumption and emotion recognition performance, indirect relationships were observed. The pattern of alcohol use over time also appears to be a critical factor. For instance, individuals who begin drinking early but do so infrequently may not develop SC deficits. Chentsova et al.38 also reported that the negative consequences of alcohol use, as indicated by high AUDIT scores, are strongly associated with age at first use, frequency, and age of habitual use. These findings underscore the importance of considering adolescent drinking patterns when identifying early vulnerability factors.
Difficulty recognizing emotions may hinder effective social interaction due to impaired interpretation of others' emotions, behaviors, and social norms. This could lead to social isolation, which in turn can increase the likelihood of substance use. Alcohol has been shown to alleviate the negative emotions associated with isolation2,10 and facilitate social bonding.11 This dynamic can initiate a vicious cycle in which alcohol use impairs SC development, which in turn reinforces alcohol consumption.
Our findings suggest that even among young individuals with relatively short drinking histories, early onset and risky consumption patterns are associated with reduced accuracy and slower responses to social stimuli. These impairments likely reflect the impact of alcohol on neurodevelopment during adolescence and early adulthood.36 Considering that, in general, slower responses are associated with attention or decision-making problems, these aspects are important to consider in future studies and interventions. These results highlight the importance of preventive strategies targeting youth, including educational programs on the consequences of substance use and policies regulating access to alcohol and other drugs, which could yield long-term benefits for neurocognitive development.
A notable feature of our sample was the predominance of young women with high educational and socioeconomic status - a demographic underrepresented in studies on SC and alcohol use. This might be attributed to our recruitment strategy via social media, which has been shown to yield a higher proportion of female participants.39,40
Our sample also showed a high prevalence of risky alcohol use, with 41.5% classified as at risk, high risk, or suggestive of dependence according to AUDIT scores. These rates exceed those reported in representative samples of Brazilian college students41 and the general population of the same age group.1 This pattern may reflect the timing of data collection (2021-2022), i.e., during the coronavirus disease 2019 pandemic, when social contact was reduced and alcohol consumption increased among young adults. During this period, alcohol consumption increased by 18.6% among Brazilians aged 18-29 years.42 Additionally, our focus on alcohol and SC may have attracted more frequent users than abstainers. This unique sample allowed us to examine SC in young women with high levels of alcohol consumption and frequent binge drinking.
Recent studies indicate that heavy drinking is increasing more among women than men.43 White et al.44 reported rising binge drinking rates among young women, while rates among men remained stable. This trend toward gender convergence in alcohol use, particularly among individuals aged 21-34, has been observed in other studies.45,46 These findings underscore the importance of examining alcohol use patterns among women and the sociocultural factors driving these changes, as well as differences in SC. In agreement with the literature, we observed higher levels of empathic concern and personal distress in women than men.
The contributions of our study include its focus on a population often underrepresented in alcohol and SC research, which has historically centered on older, predominantly male, alcohol-dependent individuals. However, some limitations should be acknowledged. Due to our recruitment strategy, the sample may not reflect the full sociodemographic diversity or alcohol use patterns among Brazilian youth. Social media algorithms may have influenced participant selection by targeting specific user groups, and the timing of posts may have further biased recruitment. To mitigate these effects, we disseminated invitations across various platforms and time slots. As data collection occurred in an online format, we cannot be totally confident that participants responded to the assessment with the attention that the tasks required or were not under the use of any substance such as alcohol, although they were instructed to perform the tests with full attention, in a quiet environment, without the presence of other people, and without being under the effect of substances. Although online data collection has been criticized for potential biases, numerous studies have validated its reliability,47-49 including in SC research.49,50 Some limitations in the instruments were also observed, as there were differences between groups 1 and 2 in basic facial emotion recognition tasks but not in complex tasks. This could be explained by the difference in the number of stimuli used in the instrument: 14 in the basic emotions task and only six in the complex emotions task. It is possible that with a larger number of stimuli, the difference between the groups could be detected. Although the participants reported not having neurological conditions, undiagnosed or undisclosed comorbidities cannot be ruled out.
The main findings of this study are that early onset of alcohol use and alcohol-related problems, in young adults significantly reduce their ability to identify emotions on faces, showing the impact of alcohol use on SC at a young age. These results contribute to ongoing discussions about the role of age at the onset of alcohol use, the importance of understanding patterns of alcohol consumption, and the impact of SC and other environmental influences in shaping alcohol-related decision-making.
ACKNOWLEDGEMENTS
This study received financial support from Coordenação de Aperfeiçoamento de Pessoal de Nível Superior (CAPES; Master Fellowship to GP, 01/2021-02/2022), Fundação de Amparo à Pesquisa do Estado de São Paulo (FAPESP; 2020/16575-6 Master Fellowship to GP, 03/2022-12/2022), Associação Fundo de Incentivo à Pesquisa (AFIP; cooperation agreements with UNIFESP #41/2019 and #83/2024), and Conselho Nacional de Desenvolvimento Científico e Tecnológico (CNPq; Productivity in Technological Development Fellowship to MLOSF 315769/2018-1).
The authors would like to thank Altay A. L. Souza for his guidance on statistical analysis, Mariana Cardoso for her collaboration in setting up the online tasks, and Marcia K. Omori for creating the figure.
 PDF
 Print
 Send this article by email
 How to cite this article
 Submit a comment
 Mendeley
 Pocket
 Share on Facebook
 Share on Twitter