


ABSTRACT:
OBJECTIVE: To describe the sociodemographic characteristics of the samples from Populations Underrepresented
in Mental Illness Association Studies in Brazil, focusing on differences between case
and control groups and ethnic variation across cities.
METHODS: This case-control study included a convenience sample of patients with schizophrenia
and bipolar disorder, alongside matched controls, from five Brazilian cities: Belém,
Fortaleza, Goiânia, Salvador, and São Paulo. The Diagnostic Interview for Psychosis
and Affective Disorders was used to confirm diagnoses and assess lifetime psychopathology
and clinical data.
RESULTS: A total of 14,017 participants (54.7% female, mean age 39.93 [SD 12.88] years) were
enrolled: 7,532 patients with either bipolar disorder (n=4,059) or schizophrenia spectrum
disorders (n=3,473), and 6,485 controls. Over 70% self-identified as Black, mixed
race (Pardos), or Indigenous. Significant differences were observed across cities in self-identified
race according to official categories. Socioeconomic disparity was significantly higher
among patients with schizophrenia than patients with bipolar disorders. A higher proportion
of individuals with severe mental illness self-identified as mixed race. Educational
attainment was lower among patients, particularly those with schizophrenia.
CONCLUSION: This is the largest and most diverse sample that has been collected in Brazil to investigate
the genetic basis of schizophrenia and bipolar disorder. It will allow critical hypotheses
to be tested in a socio-cultural and ethnic context underrepresented in large-scale
genetic studies.
Keywords: Severe mental illness; genetic; bipolar disorder; schizophrenia.
| Note: How to cite this article: Carneiro BA, Quarantini LC, Diniz M, Holanda N, Albuquerque SC, Luiz de Souza Rodrigues A, et al. Sociodemographic and clinical characteristics of Brazilian Populations Underrepresented in Mental Illness Association Studies (PUMAS): descriptive case-control study. Braz J Psychiatry. 2026;48:e20254527. http://doi.org/10.47626/1516-4446-2025-4527 |
| Received: August 01 2025; Accepted: January 04 2026 |
INTRODUCTION
Severe mental illnesses, including disorders such as bipolar disorder and schizophrenia, affect approximately 5% of the population and pose a substantial public health challenge due to their significant socioeconomic impact.1,2 Current treatments offer limited success in achieving full functional recovery, highlighting the urgent need for novel interventions.3 Progress in this area depends on a deeper understanding of the pathophysiology of these disorders. Both bipolar disorder and schizophrenia, which are synonymous with severe mental illness, are highly heritable, with heritability estimates of 60% and 80%, respectively.4,5 However, uncovering the biological pathways underlying these conditions through genetic studies has proven more complex than initially expected.
The largest genetic studies on schizophrenia and bipolar disorder have provided valuable insights into their genetic backgrounds. The Psychiatric Genomics Consortium Wave 3 schizophrenia study analyzed data from over 320,000 participants (76,000 cases and 240,000 controls), while a genome-wide association study on bipolar disorder included more than 412,000 participants (41,000 cases and 371,000 controls).6 These studies identified novel genetic loci and demonstrated significant genetic overlap with other psychiatric disorders.7,8 Notably, the PGC Cross-Disorder study (2021)6 reported a genetic correlation coefficient of approximately rg single-nucleotide polymorphism = 0.68 between schizophrenia and bipolar disorder, underscoring the importance of studying both conditions in tandem to examine their similarities and differences.
However, most genomic findings have come from studies predominantly involving individuals of European and East Asian ancestry.6,7,9-12 The largest genome-wide association study on underrepresented populations included 10,070 individuals of African ancestry and 4,324 Latin Americans.13 The limited ethnic and environmental diversity in these studies may contribute to inconsistencies in their findings, emphasizing the need for more inclusive research to better understand the genetic and environmental factors influencing these disorders.11,14 Furthermore, the restricted genetic diversity hinders the generalizability of genome-wide association study findings to other populations, potentially compromising the efficacy of future personalized medicine initiatives.
Brazil is the largest country in South America, with over 203 million inhabitants spread across 8.5 million km2. The country's unique colonization history, shaped by European, African, and Amerindian influences, has resulted in significant genetic admixture.15 Genetic ancestry analyses reveal significant regional differences in Brazil: the southern region is predominantly European, while the northern region has the highest proportion of Indigenous ancestry.16 States within regions are relatively homogeneous, except in the northeastern region, where African ancestry is significantly higher in coastal Bahia.
In addition to Brazil's underrepresentation in global genetic studies, even within Brazil, there is a lack of diversity, as most participants are from the wealthier southern and southeastern regions. No genetic studies on schizophrenia or bipolar disorder have been conducted in the northern, northeastern, or midwestern regions, underscoring the need to expand genetic research not only across countries but also within diverse regions of large, heterogeneous nations like Brazil.17 The Populations Underrepresented in Mental Illness Association Studies (PUMAS) project seeks to address the historical lack of representation of African and Latin American populations in psychiatric genetics by conducting large-scale genetic association studies of individuals diagnosed with serious mental illnesses.18,19
Therefore, we described the sociodemographic and clinical characteristics of participants in the PUMAS Brazil Study, a large case-control effort designed to enhance diversity in genetic research.
METHODS
Design
This PUMAS case-control study focused on mood disorders and psychosis. Including participants from Brazil, the United States, Colombia, Kenya, Nigeria, South Africa, Ethiopia, and Uganda, the project aims to collect and aggregate data from > 180,000 (cases and matched population controls).18 In addition to recruiting a large and diverse sample, PUMAS will perform blended genome exome for > 140,000 sequencings to enable more accurate mapping of allelic variants across these populations.19 The overarching goal of the project is to enable robust genetic analyses with sufficient statistical power across diverse ancestries, thereby increasing representation and promoting equity in mental health research. The PUMAS project is divided into two regions, Africa and the Americas, with research sites in the United States, Colombia, and Brazil. Brazilian researchers collaborate with the Universidad de Antioquia (UDeA) in Colombia and the University of California, Los Angeles (UCLA). In this article, we focus on the convenience sample of 14,017 participants, including approximately 7,532 cases and 6,485 controls.
Recruitment sites
Recruitment took place from September 2021 to April 2024. Participants were recruited from 12 mental health services across five cities, all state capitals, covering four of Brazil's five macro-administrative regions. All recruitment sites include specialized mental health services, most providing public care, and serve as reference centers for severe mental disorders in large catchment areas. We prioritized large services with academic or research experience located in major metropolitan areas of each region. These metropolitan areas have populations ranging from 2 to 20 million, collectively serving approximately 32 million people.
The selected cities and regions represent Brazil's diverse environmental, climatic, economic, and demographic characteristics. Salvador, the state capital of Bahia (northeastern region), was Brazil's first national capital and received the largest forced migration of African slaves, giving it the highest proportion of African ancestry among state capitals. Fortaleza, Ceará (northeastern region), experienced less African influence and was one of the earliest Portuguese settlements. Belém, Pará (northern region), historically served as the gateway to the Amazon, receiving waves of migrants over the years. Goiânia, Goiás, represents the midwestern region, a newer frontier of development and migration. São Paulo, capital of São Paulo state (southeastern region), is Brazil's financial center and the largest city in the Southern Hemisphere, has been shaped by intense intra- and international migration.20,21
Eligibility criteria
Two participant groups were enrolled: the case group, consisting of individuals diagnosed with schizophrenia spectrum disorder or bipolar spectrum disorder, and the control group, comprising individuals without a psychotic disorder and lacking current substance use as determined by a screening questionnaire administered by a trained interviewer. Eligible participants were required to meet the following criteria.
Case group
The inclusion criteria were 1) age > 18 years; 2) diagnosis within the broad spectrum of schizophrenia and bipolar disorder according to the DSM-5, DSM-IV, and/or ICD-10, including schizophrenia, persistent delusional disorder, schizoaffective disorder, bipolar affective disorder (predominantly bipolar disorder type I), and mania; 3) written informed consent to participate.
The exclusion criteria were 1) premorbid organic mental disorders, including but not limited to epilepsy, brain tumors, other central nervous system infections, significant head injury occurring prior to the diagnosis of schizophrenia spectrum disorder or bipolar disorder, and intellectual disability; 2) a significant premorbid history of substance dependence or alcohol use disorder, as defined by DSM-IV/DSM-5 criteria, which could confound diagnosis of schizophrenia spectrum disorder or bipolar disorder; and 3) individuals with known East Asian ancestry or recent East Asian admixture.
Control group
The inclusion criteria were: 1) age > 18 years; 2) no history of psychotic disorders; and 3) written informed consent to participate.
The exclusion criteria were: 1) meeting the diagnostic criteria (current or lifetime) for schizophrenia spectrum disorder or bipolar disorder; 2) meeting current criteria for a substance use disorder, organic mental disorders, or intellectual disability; 3) having a first-degree relative who has been diagnosed with a psychotic disorder; 4) any lifetime psychotic or manic symptoms; 5) having a relative who already participated in the study; and 6) individuals with known East Asian ancestry or recent East Asian admixture.
We excluded Asian ancestry because its recent introduction and restriction to a specific region of Brazil might preclude the attainment of an adequate sample size for genetic analysis. If the study identified any risk or psychiatric diagnosis in healthy individuals, they were referred to specialized services, either within the public health system or through private health insurance, depending on access.
Recruitment strategies and enrollment procedures
Two recruitment strategies were implemented. First, patients with a confirmed diagnosis of bipolar disorder or schizophrenia spectrum disorder who were receiving treatment at each site were invited by the staff for an in-person interview with the PUMAS team. Banners and printed materials were also distributed to raise awareness of the project among both patients and health care professionals. Interviewers wore uniforms and/or badges for easy identification by patients and site staff. The second strategy involved promoting the project through dedicated social media channels. Information about the project and related topics were shared through online advertising materials, videos, and live sessions. Volunteers who contacted the PUMAS team via social media were screened by phone, and if they had a confirmed diagnosis, were receiving treatment, and met the eligibility criteria, they were invited for an in-person interview at one of the designated sites. The communication channels included telephone, email, and private social media.
Controls were recruited through similar strategies. At each site, workers and visitors were invited to participate, and the project was also advertised on social media. Additionally, we requested that patients promote the project in their neighborhoods. Besides meeting the eligibility criteria, controls had to match a profile that was created and updated bi-monthly, with this information provided to the local teams for inclusion. The profile included four matching variables for the total sample: sex, age, race, and education level.
No payment was offered to participants, although travel costs were reimbursed when necessary. Only one subject per family (case or control) was allowed to participate. The most effective recruitment strategy was in-person, local recruitment, which accounted for over 95% of the total sample. All participants received a detailed explanation of the project's aims and procedures and, upon agreeing to participate, signed an informed consent form.
Instruments
A sociodemographic questionnaire was used to collect data on sex, educational level, individual and family income, occupational history, independent living, marital status, number of family members living together, place of birth, parents' place of birth, and receipt of government financial support. The Brazilian Institute of Geography and Statistics (Instituto Brasileiro de Geografia e Estatística), the government's official census agency, identifies race/skin color in five categories: White, Black, mixed race (Pardos), Asian, and Indigenous. Official procedures also stipulate that any classification must be self-declared. In Brazil, the PUMAS project followed these official guidelines.
The screening questionnaire consists of 32 questions selected from well-established interviews like SCID-5-RV. It screens for conditions such as mania, psychosis, depression, anxiety disorders, and substance use, including alcohol, nicotine, and other drugs, and it includes a section on medical history. This screening questionnaire was used to verify eligibility for controls and patients.
The Diagnostic Interview for Psychosis and Affective Disorders (DIPAD): a semi-structured diagnostic interview based on DSM-IV criteria and enriched for psychotic symptoms, was developed for the Diagnostic Interview for Genetic Studies22 to ensure consistency across locations. It has been used in previous large collaborative genetic studies23 and was selected for use in PUMAS. The DIPAD also collects information on disease onset, severity, and treatment. After completing the DIPAD, eligible subjects were referred for blood collection.
Professional training and quality check
The interviewers were experienced psychologists or psychiatrists who underwent rigorous training to ensure the internal validity of the collected data. This preparation included online training conducted by Brazilian researchers who were trained by the DIPAD developers. Local site coordinators performed in-person joint assessments to complement the training and routinely checked the questionnaires to ensure data quality. Quality checks were also independently and regularly conducted by the UCLA/UDeA team.
Questionnaire application
All clinical data were collected and stored in a Research Electronic Data Capture environment, a secure web-based platform, which was managed and maintained by UCLA. The estimated time to administer the protocol was 60 minutes for cases and 30 minutes for controls. To facilitate the interviews, tablets and notebooks were provided. Encrypted servers were employed to ensure the confidentiality of clinical data.
Blood collection, storage, and transport of biological samples
Eight milliliters of blood were collected via venous puncture. DNA PAXgene tubes were used to ensure the stability of the DNA. The PAXgene tubes containing blood samples could be stored at room temperature for up to 15 days after collection. Each center shipped materials to the biorepository at the Universidade Federal de São Paulo (UNIFESP) bi-weekly. After thorough checks at the central site in Brazil, the blood sample was sent to the SAMPLED repository at UCLA, and from there DNA was sent to the Broad Institute for sequencing. At the end of the project, a DNA sample from each participant will be stored at the UNIFESP biorepository.
Statistical methods
STATA 18.0 was used for all analyses and data tabulation. Categorical variables were described as absolute and relative frequencies, while continuous variables were described as means and SDs. The sociodemographic and clinical data encompassed sex, age, race/ethnicity, personal monthly income, years of education, recruitment city, marital status, employment status, and medication use. Differences in sociodemographic characteristics were assessed through a multinomial logistic regression model. Differences in medication use between participants with schizophrenia and those with bipolar disorder were evaluated using a logistic regression model. A complete case analysis was performed for each statistical test using listwise deletion. Consequently, observations were excluded only if data were missing for the specific variables required for each analysis. Statistical significance was set at p < 0.05 for all analyses.
To address the unequal distribution of sociodemographic characteristics (sex, age, personal monthly salary, race/ethnicity, employment, marital status, and years of education) between cases and controls, the inverse propensity score weighting technique was applied. Three sets of inverse propensity score weights were generated: 1) case/control; 2) schizophrenia/control; and 3) bipolar disorder/control.
The psmatch2 command in STATA was used, which employed a probit regression model to predict the diagnosis based on relevant sociodemographic characteristics. The predicted probabilities of being classified as a case were derived from significant covariates, forming the basis for the propensity scores. These scores were then inverted to create the inverse probability weights. Specifically, for cases, inverse propensity score weighting was calculated as the inverse of the estimated propensity score, while for controls, it was calculated as the inverse of one minus the propensity score.
A balance check on the covariates between cases and controls was performed to ensure that the weighting process effectively reduced confounding influences. Incorporating inverse propensity score weighting into subsequent analyses enabled adjustments for the sampling design and corrections for selection biases between cases and controls.
Ethics statement
The main Brazilian institution involved in the study was the Universidade Federal de São Paulo, and the study was approved by Brazil's National Research Ethics Committee, as well as by the institutional review boards of each participating site (CAAE: 38573520.1.1001.5505), UDeA, and UCLA.
RESULTS
Total sample
In total, 14,017 participants were enrolled in the PUMAS study from five Brazilian cities: 5,266 (37.6%) from São Paulo, 3,574 (25.5%) from Goiânia, 2,274 (16.2%) from Fortaleza, 2,190 (15.6%) from Salvador, and 713 (5.1%) from Belém.
Clinical and sociodemographic characteristics according to diagnosis
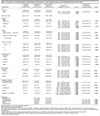
Table 1 presents the sociodemographic characteristics across the different diagnostic groups. Individuals with schizophrenia reported lower mean income levels, educational attainment, employment rates, and likelihood of being in a stable relationship than those with bipolar disorder. A higher proportion of patients with schizophrenia self-identified as Black, whereas those with bipolar disorder were more likely to self-identify as White or mixed race.
| Characteristic | No diagnosis (control) (n=6,485; 46.3%) | Schizophrenia spectrum (n=3,473; 24.8%) | Bipolar disorder spectrum (n=4,059; 29.0%) | RR (95%CI) Diagnosis vs. control | p-value┼ | OR (95%CI) Schizophrenia vs. bipolar disorder | p-value╬ |
|---|---|---|---|---|---|---|---|
| Sex | |||||||
| Female | 3,568 (55.0) | 1,353 (39.0) | 2,748 (67.7) | 1 | 1 | ||
| Male | 2,917 (45.0) | 2,120 (61.0) | 1,311 (32.3) | SCZ = 1.92 (1.76-2.08)BD = 0.58 (0.54-0.63) | < 0.001< 0.001 | 3.28 (2.99-3.61) | < 0.001 |
| Age, mean (SD) | 39.01 (12.77) | 40.40 (2.84) | 40.97 (12.99) | ||||
| Ethnicity | |||||||
| Black | 1,277 (19.7) | 703 (20.3) | 567 (14.0) | 1 | 1 | ||
| Mixed race | 3,327 (51.4) | 1,991 (57.4) | 2,367 (58.4) | SCZ = 1.09 (0.98-1.21)BD = 1.60 (1.43-1.79) | 0.128< 0.001 | 0.68 (0.60-0.77) | < 0.001 |
| Indigenous | 27 (0.4) | 16 (0.5) | 21 (0.5) | SCZ = 1.08 (0.58-2.01)BD = 1.75 (0.98-3.12) | 0.8170.058 | 0.61 (0.32-1.19) | 0.148 |
| White | 1,843 (28.5) | 757 (21.8) | 1,096 (27.1) | SCZ = 0.75 (0.66-0.85)BD = 1.34 (1.18-1.51) | < 0.001< 0.001 | 0.56 (0.48-0.64) | < 0.001 |
| Salary | |||||||
| None | 598 (9.2) | 1,432 (41.2) | 1,218 (30.0) | 1 | 1 | ||
| Annual income§ < USD 6,327 | 3,217 (49.6) | 1,739 (50.1) | 1,760 (43.4) | SCZ = 0.23 (0.20-0.25)BP = 0.27 (0.24-0.30) | < 0.001< 0.001 | 0.84 (0.76-0.91) | 0.001 |
| USD 6,327 to USD 12,654 | 2,089 (32.2) | 240 (6.9) | 675 (16.6) | SCZ = 0.05 (0.04-0.06)BP = 0.16 (0.14-0.18) | < 0.001< 0.001 | 0.30 (0.26-0.36) | < 0.001 |
| = USD 31,635 | 581 (9.0) | 62 (1.8) | 406 (10.0) | SCZ = 0.04 (0.03-0.06)BP = 0.34 (0.29-0.40) | < 0.001< 0.001 | 0.12 (0.10-0.17) | < 0.001 |
| Years of education | |||||||
| < 9 | 747 (11.5) | 1,074 (30.9) | 730 (18.0) | 1 | 1 | ||
| = 9 but < 12 | 734 (11.3) | 609 (17.5) | 473 (11.7) | SCZ = 0.58 (0.50-0.66)BP = 0.66 (0.57- 0.77) | < 0.001< 0.001 | 0.88 (0.75-1.02) | 0.087 |
| 12 | 2,536 (39.1) | 1,110 (32.0) | 1,188 (29.3) | SCZ = 0.30 (0.27-0.34)BP = 0.48 (0.42-0.54) | < 0.001< 0.001 | 0.64 (0.56-0.72) | < 0.001 |
| > 12 | 2,468 (38.1) | 680 (19.6) | 1,668 (41.1) | SCZ = 0.19 (0.17-0.22)BP = 0.69 (0.61-0.79) | < 0.001< 0.001 | 0.28 (0.24-0.32) | < 0.001 |
| Recruitment city | |||||||
| São Paulo | 2,876 (44.4) | 1,209 (34.8) | 1,181 (29.1) | 1 | 1 | ||
| Goiânia | 1,589 (24.5) | 660 (19.0) | 1,325 (32.6) | SCZ = 0.99 (0.88-1.11)BP = 2.03 (1.84-2.24) | 0.835<0.001 | 0.49 (0.43-0.55) | < 0.001 |
| Fortaleza | 1,035 (16.0) | 625 (18.0) | 614 (15.1) | SCZ = 1.44 (1.27-1.62)BP = 1.44 (1.28-1.63) | < 0.001< 0.001 | 0.99 (0.87-1.14) | 0.935 |
| Salvador | 682 (10.5) | 815 (23.5) | 693 (17.1) | SCZ = 2.84 (2.52-3.21)BP = 2.47 (2.18-2.81) | < 0.001< 0.001 | 1.15 (1.01-1.31) | 0.035 |
| Belém | 303 (4.7) | 164 (4.7) | 246 (6.1) | SCZ = 1.29 (1.05-1.58)BP = 1.98 (1.65-2.37) | < 0.001< 0.001 | 0.65 (0.53-0.81) | < 0.001 |
| Marital status | |||||||
| Married | 3,215 (49.6) | 517 (14.9) | 1,310 (32.27) | 1 | 1 | ||
| Widower | 115 (1.8) | 75 (2.2) | 110 (2.7) | SCZ = 4.06 (2.99-5.50)BP = 2.35 (1.79-3.07) | < 0.001< 0.001 | 1.73 (1.27-2.36) | 0.001 |
| Divorced | 598 (9.2) | 341 (9.8) | 679 (16.7) | SCZ = 3.54 (3.02-4.17)BP = 2.79 (2.45-3.16) | < 0.001< 0.001 | 1.27 (1.08-1.50) | 0.004 |
| Single | 2,557 (39.4) | 2,540 (73.1) | 1,960 (48.3) | SCZ = 6.18 (5.55-6.88)BP = 1.88 (1.72-2.05) | < 0.001< 0.001 | 3.28 (2.92-3.69) | < 0.001 |
| Employment situation | |||||||
| Working (full time) | 5,005 (77.2) | 297 (8.6) | 1,080 (26.6) | 1 | 1 | ||
| Working (part time) | 471 (7.3) | 131 (3.8) | 374 (9.2) | SCZ = 4.69 (3.73-5.88)BP = 3.68 (3.16-4.28) | < 0.001< 0.001 | 1.27 (1.01-1.61) | 0.045 |
| Student | 340 (5.2) | 59 (1.7) | 138 (3.4) | SCZ = 2.92 (2.17-3.95)BP = 1.88 (1.53-2.32) | < 0.001< 0.001 | 1.55 (1.12-2.16) | 0.009 |
| Unemployed | 384 (5.9) | 1,674 (48.2) | 1,415 (34.9) | SCZ = 73.46 (62.52-86.32)BP = 17.08 (14.99-19.46) | < 0.001< 0.001 | 4.30 (3.72-4.98) | < 0.001 |
| Retiree | 79 (1.2) | 110 (3.2) | 135 (3.3) | SCZ = 23.46 (17.18-32.05)BP = 7.92 (5.95-10.53) | < 0.001< 0.001 | 2.96 (2.33-3.93) | < 0.001 |
| Retired or on disability | 123 (1.9) | 1,132 (32.6) | 705 (17.4) | SCZ = 155.09 (124.49-193.22)BP = 26.56 (21.69-32.52) | < 0.001< 0.001 | 5.84 (4.98-6.85) | < 0.001 |
| Medications | |||||||
| Antipsychotics | - | 3,197 (100.0) | 3,173 (78.2) | - | - | - | || |
| Antidepressants | - | 791 (22.8) | 774 (19.1) | - | - | 1.25 (1.12-1.40) | < 0.001 |
| Benzodiazepines | - | 793 (22.8) | 1,129 (27.8) | - | - | 0.77 (0.69-0.85) | < 0.001 |
| Lithium | - | 302 (8.7) | 2,152 (53.0) | - | - | 0.08 (0.07-0.10) | < 0.001 |
| Anticonvulsants | - | 292 (8.4) | 676 (16.7) | - | - | 0.46 (0.40-0.53) | < 0.001 |
Data presented as n (%), unless otherwise specified.
Bold type denotes statistical significance.
BP = bipolar disorder spectrum; OR = odds ratios; PUMAS = Populations Underrepresented in Mental Illness Association Studies; RR = relative risk; SCZ = schizophrenia spectrum.
┼ Multinomial logistic regression assessed the likelihood of being in the schizophrenia spectrum or bipolar disorder spectrum group compared to the control group, based on sociodemographic characteristics.
╬ Logistic regression models compared sociodemographic characteristics and medication use between participants with schizophrenia and those with bipolar disorder.
§ Annual income based on the 2023 Brazilian minimum wage and the exchange rate of Brazilian currency at 5.35 BRL to 1 USD as of January 2023.
|| Omitted due to perfect prediction.
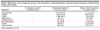
All patients with schizophrenia who provided valid information were prescribed antipsychotics (Table 2). Lithium was the most frequent medication among bipolar patients, although antipsychotic use was also high.
| Medication | No diagnosis (control) (n=6,485; 46.3%) | Schizophrenia spectrum (m=3,473; 24.8%) | Bipolar disorder spectrum (n=4,059; 29.0%) |
|---|---|---|---|
| Antipsychotics | - | 3,197 (100.0) | 3,173 (78.2) |
| Atypical | - | 2,458 (76.9) | 2,692 (66.3) |
| Typical | - | 1,380 (43.2) | 1,012 (24.9) |
| Paliperidone | - | 46 (1.4) | 10 (0.25) |
| Antidepressants | - | 791 (22.8) | 774 (19.1) |
| Benzodiazepines | - | 793 (22.8) | 1,129 (27.8) |
| Lithium | - | 302 (8.7) | 2,152 (53.0) |
| Anticonvulsant | - | 292 (8.4) | 676 (16.7) |
Data presented as n (%).
For the patient group, we performed an ethnic comparison between cities to assess regional differences (Supplementary Table S1). As expected, Salvador had the highest proportion of individuals identifying as Black, while the highest proportion of self-reported Whites was in São Paulo. Fortaleza had the largest proportion of individuals identifying as mixed race. The number of self-reported Indigenous individuals was low across all cities, even Belém.
DISCUSSION
The PUMAS Brazil Study, a multi-center case-control initiative, characterized the sociodemographic and clinical profiles of its14,017 participants. Importantly, > 70% of the sample self-identified as mixed race, Black, or Indigenous, which confirms the study's success in recruiting populations traditionally underrepresented in genetic studies of schizophrenia and bipolar disorder in Brazil.
As expected, differences in self-reported race were observed across study sites. Although the combined case group (schizophrenia and bipolar spectrum) and controls showed similar distributions in age and sex, the case group had a significantly higher proportion of mixed race individuals and a correspondingly lower proportion of Whites. This disparity, coupled with the case group's significantly poorer social and occupational functioning (lower income, educational attainment, and employment rates), strongly suggests socioeconomic confounding and selection bias. In Brazil, self-identifying as Black or mixed race is a proxy for socioeconomic vulnerability, directly correlating with lower income and educational attainment.24 Because case recruitment occurred largely within public, specialized mental health services, which typically serve individuals from lower socioeconomic strata, our sampling strategy likely captured a population with high illness severity and associated social disadvantage. This pattern is reinforced internally; patients with schizophrenia, who generally face worse long-term functional outcomes, had poorer socioeconomic indicators and a higher proportion of Blacks than the bipolar disorder subgroup. Moreover, the literature indicates that individuals of African ancestry are more susceptible to schizophrenia and have a greater likelihood of admittance to inpatient units than other groups.25 This potential diagnostic and access bias could further contribute to the observed high proportion of mixed race/Black individuals in our case group by influencing both perceived severity and point of entry into specialized services. Specifically, allowing the inclusion of hospital staff members in the control group may have resulted in an upward selection bias in educational and occupational levels. Nevertheless, the consistently lower socioeconomic indicators in the case group also reflect the true functional impairments associated with severe mental illnesses. Consequently, the observed ethnic-racial difference between cases and controls is best interpreted as a sociodemographic artifact arising from the recruitment context, rather than reflecting a direct biological association.
Race/ethnicity can be viewed from various perspectives and must be contextualized within Brazil. While the older definition of race refers to physical traits, ethnicity encompasses historical and cultural aspects. The concept of race as a biological category is no longer accepted, as it is now regarded merely as a social construct. Brazil's official classification system relies primarily on skin color, but in practice, it extends to other physical features, reflecting a classical racial perspective rooted in the country's history of colonization, slavery, and racial mixing. However, self-identification allows for the inclusion of factors beyond physical appearance, making it more aligned with an ethnic perspective. Since the 2000 census, the White population has decreased more than expected, while mixed race, Black, and Asian populations have grown, suggesting racial reclassification beyond demographic factors.26 Discrepancies between self-perception and external assessment add complexity to interpreting data from the current official system.27,28 The largest study on ethnic self-classification and genomic ancestry in Brazil found a significant but non-linear correlation, particularly in regions with high African ancestry.29 It was observed that in Salvador, even individuals with elevated African ancestry showed a propensity to self-identify as White compared to individuals from the other cities. Even within each group there are differences, as Brazil's Indigenous and African populations are diverse, with African groups originating from distinct regions such as the Gold Coast (Ghana, Togo, Benin, and Nigeria) and Angola, being taken to different Brazilian regions. Genetic studies have also demonstrated the diverse African population in different regions of Brazil.20 Individuals classified as Pardo can represent varying degrees of genetic admixture depending on the region. For instance, in Salvador, a higher proportion of African ancestry would be expected, while in Belém, greater Indigenous ancestry would be expected. In summary, ethnic-racial classification in Brazil is influenced by both genomic ancestry and non-biological factors such as culture, history, and geography - all of which should be considered in future PUMAS analyses. The samples of current studies generally consist of individuals of European ancestry, which can bias genetic estimates. For example, to compute the polygenic risk score, a valuable tool that condenses the impact of multiple genetic variants into a single measure, it is essential to define an appropriate reference sample. However, polygenic risk scores vary across populations, especially in non-White, non-European groups, highlighting the need for more diverse reference panels.30 In a Brazilian cohort of schizophrenia patients, the total variance explained by the polygenic risk score was lower than expected, and concerns have also been raised about the imputation procedures, which perform worse in non-European populations.31 Given that each population, shaped by its unique demographic history, is likely to have distinct genetic characteristics, we remain uncertain about the extent of diversity required to optimize polygenic risk score accuracy. Nevertheless, a more representative reference panel is likely to yield more accurate results for a given population. Previous genetic studies in Brazil have predominantly focused on the southern and southeastern regions, recruiting participants from academic institutions, which has introduced sampling biases for patients and controls.32,33 In this context, our study represents a significant step forward in the investigation of severe mental disorders in Brazil.
In the most recent census, the national proportion of self-declared mixed-race individuals was 45.3%, followed by Whites (43.5%), Blacks (10.2%), Indigenous (0.6%), and Asians (0.4%).34 In our sample there was a higher proportion of mixed race and Black participants and a lower proportion of White participants than national estimates. The proportion of Indigenous participants was similar to Brazilian census data for the overall sample (0.6%) but was lower than expected in Belém (3.1%). We suspect that this may reflect the Indigenous population's difficulties in accessing standard mental health services.35,36 The differences observed in racial proportions between centers also confirmed that the sampling strategy resulted in a diverse group.
Although there were some differences between groups, the racial distribution between cases and controls remained relatively similar. Educational attainment was a greater challenge. In urban areas, most adults have completed at least high school, whereas the patient group, particularly those with schizophrenia spectrum disorders, had significantly lower educational levels, which aligns with current literature.37 Despite this, our control group also had lower educational attainment than the respective local estimates. This discrepancy is likely due to the convenience-based recruitment strategy, where controls were often recruited from the same locations as the cases. To account for discrepancies in matching variables, we created statistical weights to be used where necessary in future studies (Supplementary Table S2).
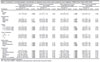
The lower socioeconomic indicators observed among patients with schizophrenia and bipolar disorder were expected.38 Outcomes in the bipolar disorder group were significantly better across all socioeconomic measures than in the schizophrenia group, which is consistent with the literature. However, unemployment was higher and income was lower in the bipolar group than the control group, despite relatively similar educational attainment (due to the recruitment matching procedures). This also highlights the substantial burden associated with bipolar disorder.39 The overall high unemployment and lower educational achievement suggest that our recruitment procedures, which focused on services specialized for severe mental disorders, captured a particularly severe subset of patients with schizophrenia and bipolar disorder. This should be considered when interpreting the results. Although medication use was not the primary focus of this study, we included it to demonstrate alignment with standard treatment practices for schizophrenia and bipolar disorder. Combined with the sociodemographic data, this supports the reliability of our diagnostic approach. To address the differences between patient groups and the control group, we created an additional set of weights to be applied depending on the specific objectives of the analysis (Table 3).
| Before applying the inverse propensity score weight | Applying inverse propensity score weight | Before applying the inverse propensity score weight | Applying inverse propensity score weight | |||||
|---|---|---|---|---|---|---|---|---|
| Participants | OR (95%CI) Schizophrenia vs. control | p-value | OR (95%CI) Schizophrenia vs. control | p-value | OR (95%CI) Bipolar disorder vs. control | p-value | OR (95%CI) Bipolar disorder vs. control | p-value |
| Sex | ||||||||
| Female | 1 | 1 | 1 | |||||
| Male | 1.92 (1.76-2.08) | < 0.001 | 0.91 (0.71-1.18) | 0.480 | 0.58 (0.54-0.63) | < 0.001 | 0.95 (0.84-1.07) | 0.396 |
| Race/ethnicity | ||||||||
| Black | 1 | 1 | 1 | 1 | ||||
| Mixed race | 1.09 (0.98-1.21) | 0.128 | 0.98 (0.70-1.38) | 0.923 | 1.60 (1.43-1.79) | < 0.001 | 0.97 (0.82-1.15) | 0.741 |
| Indigenous | 1.08 (0.58-2.01) | 0.817 | 0.44 (0.18-1.08) | 0.074 | 1.75 (0.98-3.12) | 0.058 | 0.81 (0.42-1.56) | 0.525 |
| White | 0.75 (0.66-0.85) | < 0.001 | 1.23 (0.83-1.82) | 0.294 | 1.34 (1.18-1.51) | < 0.001 | 1.01 (0.84-1.22) | 0.913 |
| Income | ||||||||
| None | 1 | 1 | 1 | 1 | ||||
| < 2 x minimum wage | 0.23 (0.20-0.25) | < 0.001 | 1.07 (0.82-1.40) | 0.597 | 0.27 (0.24-0.30) | 0.001 | 1.00 (0.87-1.17) | 0.923 |
| 2-4 x minimum wage | 0.05 (0.04-0.06) | < 0.001 | 1.42 (0.97-2.10) | 0.071 | 0.16 (0.14-0.18) | < 0.001 | 1.08 (0.91-1.28) | 0.375 |
| = 5 x minimum wage | 0.04 (0.03-0.06) | < 0.001 | 0.91 (0.56-1.45) | 0.679 | 0.34 (0.29-0.40) | < 0.001 | 0.96 (0.77-1.19) | 0.703 |
| Years of education | ||||||||
| < 9 | 1 | 1 | 1 | 1 | ||||
| = 9 to < 12 | 0.58 (0.50-0.66) | < 0.001 | 0.98 (0.69-1.38) | 0.895 | 0.66 (0.57- 0.77) | < 0.001 | 0.96 (0.77-1.21) | 0.753 |
| 12 | 0.30 (0.27-0.34) | < 0.001 | 1.07 (0.78-1.48) | 0.664 | 0.48 (0.42-0.54) | < 0.001 | 1.01 (0.84-1.21) | 0.932 |
| > 12 | 0.19 (0.17-0.22) | < 0.001 | 1.31 (0.91-1.87) | 0.145 | 0.69 (0.61-0.79) | < 0.001 | 1.01 (0.85-1.20) | 0.913 |
| Marital status | ||||||||
| Married/cohabiting | 1 | 1 | 1 | 1 | ||||
| Widower | 4.06 (2.99-5.50) | < 0.001 | 1.17 (0.51-2.69) | 0.715 | 2.35 (1.79-3.07) | 0.001 | 0.95 (0.65-1.38) | 0.786 |
| Divorced/separated | 3.54 (3.02-4.17) | < 0.001 | 0.72 (0.49-1.06) | 0.100 | 2.79 (2.45-3.16) | < 0.001 | 0.91 (0.75-1.10) | 0.333 |
| Single | 6.18 (5.55-6.88) | < 0.001 | 0.81 (0.61-1.06) | 0.128 | 1.88 (1.72-2.05) | < 0.001 | 1.02 (0.91-1.16) | 0.694 |
| Employment | ||||||||
| Full time | 1 | 1 | 1 | 1 | ||||
| Part time | 4.69 (3.73-5.88) | < 0.001 | 0.86 (0.61-1.21) | 0.376 | 3.68 (3.16-4.28) | < 0.001 | 0.96 (0.81-1.13) | 0.613 |
| Homemaker/caregiver | 14.21 (10.13-19.95) | < 0.001 | 0.74 (0.50-1.12) | 0.152 | 11.84 (9.11-15.38) | < 0.001 | 0.84 (0.61-1.15) | 0.276 |
| Student | 2.92 (2.17-3.95) | < 0.001 | 0.85 (0.55-1.33) | 0.487 | 1.88 (1.53-2.32) | < 0.001 | 0.96 (0.76-1.20) | 0.705 |
| Unemployed | 73.46 (62.52-86.32) | < 0.001 | 0.86 (0.67-1.10) | 0.223 | 17.08 (14.99-19.46) | < 0.001 | 1.02 (0.88-1.19) | 0.762 |
| Retiree | 23.46 (17.18-32.05) | < 0.001 | 0.86 (0.58-1.26) | 0.435 | 7.92 (5.95-10.53) | < 0.001 | 1.05 (0.78-1.42) | 0.731 |
| Retired or on disability | 155.09 (124.49-193.22) | < 0.001 | 0.94 (0.61-1.43) | 0.758 | 26.56 (21.69-32.52) | < 0.001 | 1.01 (0.79-1.30) | 0.931 |
Bold type denotes statistical significance.
OR = odds ratio; PUMAS = Populations Underrepresented in Mental Illness Association Studies.
Additionally, we highlight that typical antipsychotics are still used by a substantial number of patients; conversely, the use of long-acting injectable medications, such as paliperidone, remains notably low (Table 2). This persists despite several studies suggesting that second-generation antipsychotics have a better safety and tolerability profile, as well as that long-acting injectable are superior in preventing relapse, although the findings of recent reviews are conflicting.40,41
Some limitations of our study must be considered. First, the case-control study design limits the exploration of hypotheses with a temporal dimension. Second, the convenience sample, centered on large mental health services, limits generalization and must be accounted for in data interpretation. Third, despite efforts to match cases and controls, the differences between patients with schizophrenia and bipolar disorder, along with their overall lower educational levels, were a challenge. However, these differences indicate the true sociodemographic effects associated with severe mental disorders. Among the strengths of the study, we highlight the large sample size and the inclusion of a predominantly non-White population in diverse cultural and environmental settings.
In conclusion, this study offers valuable sociodemographic insight into individuals with schizophrenia and bipolar disorder in Brazil. We also hope that increased focus on underrepresented populations in genetic studies has a dual impact: enhancing our understanding of disease neurobiology and providing more accurate estimates while also ensuring that socially vulnerable populations can benefit from the resulting advancements and technologies.
SUPPLEMENTARY MATERIALS
ACKNOWLEDGEMENTS
The study was funded by the U.S. National Institutes of Health (NIH) through grants aimed at increasing ethnic diversity in psychiatric research (NIMH U01MH125042). This study was supported by the Coordenação de Aperfeiçoamento de Pessoal de Nível Superior (CAPES) - Funding Code 001.
 PDF
 Print
 Send this article by email
 How to cite this article
 Submit a comment
 Mendeley
 Pocket
 Share on Facebook
 Share on Twitter