


ABSTRACT:
OBJECTIVE: Given the interest in the potential effects of cannabis on medical students, this
study aimed to establish the prevalence of recreational use in this population.
METHODS: We searched MEDLINE, LILACS, PubMed, Embase, PsycINFO/PsycArticles/APA Books, and
SciELO for observational studies published before June 9, 2025 on the reported prevalence
of cannabis use among medical students. We conducted subgroup analyses based on sex,
study cycle, school type, decade of publication, and world region. Data were pooled
using a random-effects model.
RESULTS: Our search identified 109 studies meeting the inclusion criteria, published between
1971 and 2025, encompassing data from 62,444 participants in 32 countries. The lifetime
prevalence was 29.2%, 20.5% in the past year, 9.2% in the past month, and 5.1% in
the past week. The global prevalence decreased from 38.4% in the 1970s (95%CI 19.2-57.7)
to 18.1% in the 2000s (95%CI 13.6-23.8) and increased again to 30.4% in the 2020s
(95%CI 19.2-41.6), driven by trends in Latin America, Asia, and Africa. The lowest
prevalence was in Asia (11.5%, 95%CI 07.1-15.8) and the highest was in the U.S. and
Canada (59.7%, 95%CI 53.1-66.3).
CONCLUSION: Cannabis use is prevalent among medical students, with an increasing trend and regional
variations. Targeted interventions are needed to raise awareness of the associated
risks.
SYSTEMATIC REVIEW REGISTRATION: PROSPERO, CRD42021272280
Keywords: Cannabis; medical students; epidemiology; substance use.
FIGURES
| Note: How to cite this article: Karpovisch E, Alves GG, Folgierini VF, Braun LE, Porto IM, Hoffmann MS, et al. Global temporal and regional trends in cannabis use among medical students: a systematic review and meta-analysis. Braz J Psychiatry. 2026;48:e20254286. Epub 2025 Sep 29. http://doi.org/10.47626/1516-4446-2025-4286 |
| Received: April 22 2025; Accepted: August 18 2025 |
INTRODUCTION
Cannabis is one of the most widely used recreational drugs globally,1 with increasing legalization and decriminalization in many countries. Although debate continues about its potential therapeutic benefits and other perceived benefits like stress relief or social connection, cannabis use has been associated with a variety of potential health risks, including cardiovascular2 and pulmonary3 problems, psychiatric disorders,4,5 cognitive impairment, and addiction.6
The context of medical training, characterized by high academic pressure, long hours, and significant emotional demands, makes substance use patterns in this group a key public health issue. Cannabis use among medical students is particularly relevant in this context. Studies have associated its use during college with lower academic performance7 and neurocognitive impairment, including memory and attention deficits.8 Additionally, it may contribute to decreased motivation and exacerbate pre-existing psychiatric disorders.9 Recreational use in young adulthood has also been linked to lower university degree attainment rates.10,11 While these associations do not imply causation, they highlight the importance of assessing the prevalence of cannabis use among medical students. Therefore, establishing clear and updated prevalence estimates is a fundamental first step before potential effects can be further investigated.
Medical students are generally expected to have greater awareness of the risks associated with cannabis use than their peers in the general population. However, a 2018 meta-analysis found a high prevalence of cannabis use among medical students, with 17.2% reporting past-year use and 31.4% reporting lifetime use.12 Since the aforementioned study, an additional meta-analysis13 has been published, primarily on physicians but lacking a clearly defined medical student subgroup. With the evolving landscape of cannabis legalization and shifting cultural attitudes, understanding global trends in cannabis use among medical students requires an updated analysis. However, there has not been a thorough comparison of emerging or declining trends across continents and decades. This study addressed these gaps by updating previous meta-analyses with recent studies and expanding the search to additional databases. Specifically, we compared the prevalence of cannabis use across regions and historical periods, providing a comprehensive global profile of trends among medical students.
METHODS
This review's protocol was registered in the International Prospective Register of Systematic Reviews (number CRD42021272280).
Eligibility criteria
We included studies that met the following eligibility criteria: 1) observational study designs investigating the prevalence of recreational cannabis use among medical students, reporting data for at least one of the prevalence periods of interest for this review; 2) focus exclusively on use of the natural cannabis plant, excluding synthetic derivatives - if the type of cannabis was unspecified, it was considered natural; 3) the inclusion of unpublished studies identified during the search phase; and 4) study designs including longitudinal, cross-sectional, or web-based surveys to ensure a broad perspective and maximize relevant data collection. We excluded studies that: 1) reported exclusively non-recreational cannabis use; 2) grouped medical and non-medical students without a subgroup analysis; 3) reviews, meta-analyses, interventional studies, or other publications such as books, editorials, or book chapters; 4) intervention studies that reported cannabis use at baseline (due to their significant methodological differences from observational studies); and 5) studies without full-text availability despite attempts to contact the authors.
Information sources
We searched the following databases from inception until June 20, 2025: BVS (MEDLINE, LILACS), PubMed, Embase, PsycINFO/PsycArticles/APA Books, and SciELO. The reference lists of the included studies were also manually screened. The database results were merged using EndNote to facilitate the duplicate screening.
Search strategy
The review team developed a common search strategy, including terms related to cannabis, medical students, prevalence, use, abuse, etc. The complete search strategy is available in Supplementary Table S1. No limitations were applied to the search.
Selection process
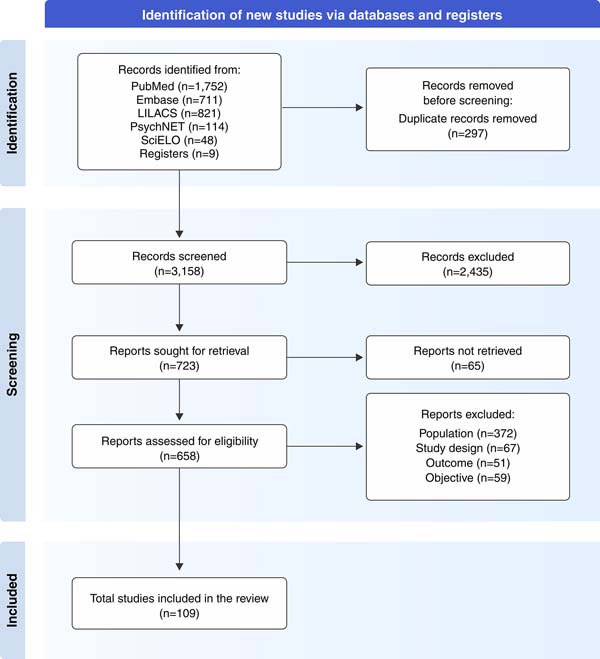
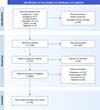
Following duplicate removal using EndNote, two reviewers independently screened the titles and abstracts of all identified studies for eligibility. The full texts of potentially relevant articles were then retrieved and assessed independently by two reviewers to determine final inclusion. Any discrepancies at either the title/abstract or the full-text screening stage were resolved through discussion or, if necessary, by consulting a third reviewer. The selection process is depicted in the Preferred Reporting Items for Systematic Reviews and Meta-Analyses flowchart (Figure 1).
Data collection process
Using a standardized, pre-piloted form, data from each included study were extracted by two reviewers working independently. Any discrepancies identified during the extraction process were resolved by consensus or, if necessary, through arbitration by a third reviewer. When essential data were missing from the published reports, the corresponding authors were contacted via email.
Data items
The extracted variables included publication details, geographical location, study type, study population, mean age, sex proportion, prevalence or incidence of cannabis use. Data on cannabis legalization in each country were manually assessed by the reviewers, focusing on the legal status of cannabis in the respective country (or state, for federal systems with state-level autonomy) during the specified year. The legal status of cannabis was dichotomized as legal or illegal. In countries with decriminalization policies, cannabis was classified as legal. For this analysis, multicenter studies were excluded if they were conducted across jurisdictions with different legal statuses or if the specific locations were not reported by the authors. Sex data were collected in absolute numbers, either extracted directly from the text or calculated based on the proportions provided. For studies that did not report the number of male and female participants, the corresponding author was contacted via email. If the author provided the data, they were included in subsequent analyses; otherwise, the study was excluded from sex-specific analyses. For the time frame, we only included data that aligned with the specific categories defined for our analysis (e.g., lifetime use, past-year use, past-month use, and past-week use). For example, data were included in the "past-month use" category only if the study explicitly reported usage within the past month. The same approach was applied to other time frames. If a study reported two or more time frames in the same sample, these results were analyzed independently, with a separate meta-analysis conducted for each time frame. The primary outcome for this review was the prevalence of recreational lifetime cannabis use among medical students. Secondary outcomes included: 1) the prevalence of cannabis use across other recall periods (i.e., past year, past month, and past week); and 2) analyses of lifetime use within key subgroups, including decade, continent, and sex.
Risk of bias
For each search phase, two reviewers independently assessed the included studies for reporting of ethical approval and conducted a risk-of-bias assessment using the Joanna Briggs Institute Critical Appraisal Checklist for Studies Reporting Prevalence Data (JBI).14 This tool was selected for its ability to address both external and internal validity, as well as its high inter-rater reliability. A detailed description of the objective criteria for each JBI item is provided in Supplementary Figure S1 (in the footnotes).
Effect measures
The data were analyzed by EK and JPGP. A double arcsine transformation was applied to prevalence data before pooling and back-transformation. When studies provided appropriate data, the data were pooled using a random-effects model. We assessed heterogeneity using the I2 statistic and considered a value of 75 to 100% to represent high heterogeneity.15 All meta-analyses were performed using R with the Metafor package.16
Synthesis methods
To assess absolute cannabis use prevalence, we considered the following time frames: 1) lifetime use; 2) past-year use; 3) past-month use; and 4) past-week use. For subgroup analyses, we considered the following characteristics: 1) decade of data collection; 2) continent; 3) legalization; 4) sex; 5) study cycle (e.g., preclinical, clinical, internship); and 6) public or private medical school. Regarding study cycle, the preclinical phase (comprising the initial years of medical school but not undergraduate pre-med students) generally covers basic sciences, the clinical phase involves exposure to medical specialties, and the internship focuses on practical medical training, although curricular structures vary across countries.
When at least four studies were available for a given analysis, we investigated potential sources of heterogeneity. These subgroup analyses were conducted using mixed-effects meta-regression models. For these moderator analyses, we report the overall p-value, the proportion of heterogeneity explained by the model (R2), and the amount of residual heterogeneity (I2). The specific pooled estimate for each individual subgroup is presented with its 95%CI the number of included studies (k), and the within-subgroup heterogeneity (I2).
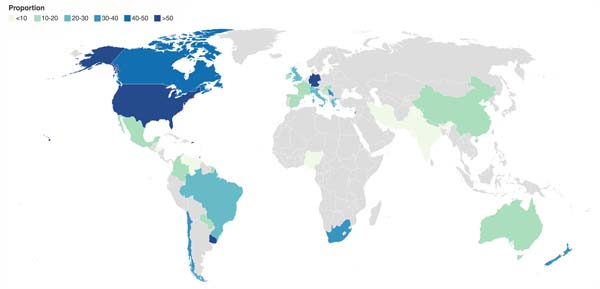
To complement the categorical analysis of decades, a univariable meta-regression was also performed to assess the linear trend of publication year as a continuous variable. Results from the analyses were presented in forest plots. We used datawrapper.de to create a world map displaying the pooled prevalence rates of lifetime cannabis use of different countries.
Reporting bias assessment
Evidence of publication bias was assessed using Egger's test. If publication bias was detected, the trim-and-fill method was applied to estimate and adjust for the missing studies.
RESULTS
Study characteristics
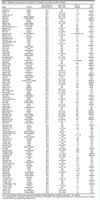
A total of 109 studies from 32 countries (62,444 participants) were included. Most of them (105) were cross-sectional in design, with Brazil (21 studies), the United States (20 studies), and the United Kingdom (eight studies) being the most represented countries. Regarding institutional setting, the studies were predominantly conducted in public universities (59 studies), followed by a mix of public and private institutions (24 studies), and private institutions (17 studies). The mean sample size was 572.9 (range: 61-4942), and the average of reported mean ages was 22.7 years (range of means: 18.8-27.7). A total of 46.7% of the participants were male (range: 22.3-100%). The study characteristics are detailed in Table 1.
| Study┼ | Country | Sex proportion (male/overall) (%) | Age, mean (SD), years | Year of training | JBI score |
|---|---|---|---|---|---|
| Adhikari [1] | Nepal | 51.0 | N/A | 1-6 | Low |
| Aguilar [2] | Mexico | 37.0 | N/A | 6 | Medium |
| Ali [3] | India | 58.1 | 19.6 (1.8) | 1, 2, 6 | Low |
| Araújo-Filho [4] | Brazil | 58.1 | 22.6 (N/A) | 1-6 | Medium |
| Ashton [5] | United Kingdom | 41.4 | 20.4 (1.8) | 2 | Low |
| Ayala [6] | United States | 35.6 | 25.6 (3.3) | 3, 4 | Medium |
| Ayinde [7] | Nigeria | 56.4 | N/A | 1-6 | Medium |
| Bahji [8] | Canada | 35.7 | 24.2 (3.5) | 1-6 | Low |
| Baldwin [9] | United States | 62.7 | 27.7 (0.8) | 4 | Low |
| Baldwin [10] | United States | 57.7 | N/A | N/A | Low |
| Barahona-Correa [11] | Colombia | 36.0 | N/A | 1-5 | Medium |
| Baptista [12] | Venezuela | 29.6 | 23.0 (3.7) | N/A | Low |
| Batista [13] | Brazil | 52.5 | N/A | N/A | Low |
| Bíró [14] | Hungary | 43.0 | 22.0 (N/A) | N/A | Medium |
| Bogowicz [15] | United Kingdom | 46.9 | N/A | 1, 2, and final year | Low |
| Boniatti [16] | Brazil | 45.9 | 22.5 (2.4) | 1-6 | Low |
| Buchanan [17] | Honduras | 44.2 | N/A | 3, 4 | Medium |
| Budhathoki [18] | Nepal | 63.5 | N/A | 3 | Low |
| Carvalho [19] | Brazil | 57.0 | 21.5 (N/A) | 1-6 | Low |
| Castaldelli-Maia [20] | Brazil | 23.3 | N/A | 1-6 | High |
| Cerame [21] | Italy | 47.6 | 18.8 (1.0) | 1 | Low |
| Chakraborty [22] | India | 87.1 | N/A | N/A | Medium |
| Chan [23] | United States | 48.3 | N/A | 1-4 | Low |
| Chau [24] | China | 46.3 | N/A | 1-6 | High |
| Choi [25] | United States | 36.0 | N/A | 1-4 | Low |
| Chung [26] | China | 56.5 | N/A | 1-6 | Low |
| Conard [27] | United States | 65.0 | 27.6 (N/A) | 4 | Medium |
| Croen [28] | United States | 54.1 | N/A | 1, 3 | Low |
| Da Silveira [29] | Brazil | 54.2 | 21.0 (N/A) | 1-6 | Medium |
| Di Pietro [30] | Brazil | 54.2 | 21.1 (2.4) | 1-6 | Low |
| Eiselen [31] | South Africa | 36.8 | N/A | = 18 months | Medium |
| Engs [32] | Australia | N/A | N/A | 1, 4 | High |
| Epstein [33] | United States | N/A | N/A | N/A | Medium |
| Esteche [34] | Uruguay | 29.9 | 23.9 (N/A) | 5 | Medium |
| Farías [35] | Venezuela | N/A | N/A | N/A | High |
| Farrell [36] | New Zealand | 29.5 | N/A | 1-6 | Medium |
| Ferreira [37] | Brazil | 49.9 | 22.8 (3.1) | 1-6 | Low |
| Gaume [38] | Switzerland | 31.0 | 22.4 (3.3) | 1-6 | Low |
| Gignon [39] | France | 43.8 | 22.1 (1.7) | 2-6 | Medium |
| Infortuna [40] | United States | 48.3 | 26.9 (2.3) | 1-4 | Medium |
| Jain [41] | South Africa | 45.7 | N/A | 1-5 | Low |
| James [42] | Nigeria | 54.5 | 24.1 (2.4) | 5 | Low |
| Jankie [43] | Trinidad and Tobago | 30.5 | 22.9 (3.2) | 1-5 | Medium |
| Jepsen [44] | Germany | 29.8 | 23.6 (3.4) | 1-6 | Medium |
| Jodati [45] | Iran | 100.0 | 21.3 (N/A) | N/A | Medium |
| Jovin [46] | Serbia | N/A | N/A | 1-6 | High |
| Kadhum [47] | Multiple | 44.0 | N/A | N/A | High |
| Keller [48] | Germany | 38.0 | 20.6 (1.7) | 1 | Low |
| Kerr-Corrêa [49] | Brazil | 53.0 | 21.7 (N/A) | 1-6 | Low |
| Khanal [50] | Nepal | 57.2 | 21.2 (2.3) | 1, 6 | Low |
| Konstantinov [51] | Multiple | 43.2 | 21.2 (2.8) | N/A | Low |
| Kory [52] | United States | 71.4 | N/A | 1-4 | Medium |
| Laporte [53] | Spain | 63.7 | N/A | 1-6 | Low |
| Lemos-Santos [54] | Brazil | 57.8 | 23.0 (N/A) | 1-6 | Medium |
| Levin [55] | South Africa | N/A | N/A | 1-5 | Low |
| Lipp [56] | United States | N/A | N/A | N/A | High |
| Lokesh [57] | India | 56.2 | 20.0 (1.3) | 1-5 | Medium |
| Lucas [58] | Brazil | 44.7 | 22.7 (N/A) | 1-6 | Low |
| Maddux [59] | United States | N/A | N/A | 3-4 | Low |
| Maier [60] | Swiss | N/A | N/A | N/A | High |
| Makanjuola [61] | Nigeria | 69.0 | 22.4 (3.2) | N/A | Medium |
| Marcon [62] | Brazil | 22.3 | 21.8 (3.2) | 1-6 | Medium |
| McAuliffe [63] | United States | 69.0 | 25.0 (N/A) | N/A | Medium |
| McAuliffe [64] | United States | 59.0 | 25.0 (N/A) | N/A | Low |
| McKay [65] | Scotland | 68.7 | N/A | 1-6 | Medium |
| Mechanick [66] | United States | 91.6 | 23.6 (N/A) | N/A | Medium |
| Mehmood [67] | Pakistan | 60.7 | 21.3 (1.7) | 4 | Low |
| Merlo [68] | United States | 42.9 | N/A | 1-4 | Low |
| Mesquita [69] | Brazil | 58.1 | N/A | N/A | Medium |
| Moaouad [70] | Lebanon | 49.3 | N/A | 1-7 | Low |
| Moutinho [71] | Brazil | 35.8 | 21.0 (2.6) | N/A | High |
| Nawaz [72] | Pakistan | 55.2 | N/A | 1-6 | Low |
| Newbury-Birch [73] | United Kingdom | 33.0 | 18.8 (2.1) | 1 | Low |
| Newbury-Birch [74] | United Kingdom | 33.3 | N/A | 2, 5 | Low |
| Oliveira [75] | Brazil | 52.0 | 21.0 (N/A) | 1, 2, 5, 6 | Low |
| Palin [76] | United Kingdom | 24.4 | N/A | 1-6 | Medium |
| Papazisis [77] | Greece | 43.7 | 21.7 (1.8) | N/A | Low |
| Parfrey [78] | Ireland | 59.7 | N/A | N/A | Low |
| Passos [79] | Brazil | 47.0 | 21.1 (3.9) | 1-6 | Low |
| Pereira [80] | Brazil | 44.0 | N/A | 1, 6 | Low |
| Petroianu [81] | Brazil | 48.2 | 23.0 (N/A) | 1-6 | Low |
| Pickard [82] | United Kingdom | 33.8 | N/A | 2 | Low |
| Rai [83] | India | 71.0 | 20.5 (N/A) | N/A | Medium |
| Rochford [84] | United States | N/A | 22.0 (N/A) | N/A | Low |
| Rodriguez [85] | Spain | 48.2 | N/A | N/A | High |
| Rodriguez [86] | Nicaragua | 42.6 | 19.2 (N/A) | 1, 2 | Medium |
| Romero [87] | Chile | 55.0 | 21.5 (N/A) | 1-7 | Medium |
| Rossi [88] | Paraguay | 45.5 | 22.7 (2.3) | 1-5 | Low |
| Safiri [89] | Iran | 40.7 | N/A | N/A | Low |
| Sapkota [90] | Nepal | 52.2 | 22.0 (N/A) | 2-3 | Low |
| Schwartz [91] | United States | 65.0 | N/A | 2, 3 | Low |
| Schwarzbold [92] | Brazil | 41.5 | 23.0 (N/A) | 1-4 | Low |
| Serrano [93] | Colombia | 48.6 | N/A | 1-6 | Low |
| Shrestha [94] | Nepal | 58.0 | 20.0 (1.5) | 1-4 | Medium |
| Siebra [95] | Brazil | 60.3 | N/A | 1, 5, 6 | Low |
| Singh [96] | India | 62.0 | N/A | N/A | Medium |
| Slaby [97] | United States | 94.1 | 23.3 (N/A) | 1-4 | Low |
| Smit09 [98] | South Africa | 48.8 | N/A | 1, 4, 5 | Low |
| Solursh [99] | United States | N/A | N/A | N/A | Medium |
| Talih [100] | Lebanon | 51.2 | N/A | 1-4 | Low |
| Tavolacci [101] | France | 39.0 | 21.6 (1.8) | 2-5 | Low |
| Tockus [102] | Brazil | 42.0 | N/A | 1-4 | Medium |
| Trkulja [103] | Croatia | 39.0 | N/A | 1-6 | Low |
| van Meerbeke [104] | Colombia | N/A | N/A | 1 | Medium |
| Vaysse [105] | France | 42.0 | 19.7 (0.9) | 2 | Low |
| Vorster [106] | South Africa | 42.1 | N/A | 2-3 | Low |
| Vujcic [107] | Serbia | 37.3 | 22.5 (1.1) | 4 | Low |
| Webb [108] | United Kingdom | 44.2 | 20.0 (N/A) | 2 | Low |
| Zhou [109] | United States | 50.3 | 25.0 (N/A) | 1-4 | Low |
JBI = Joanna Briggs Institute Critical Appraisal Checklist for Studies Reporting Prevalence Data; N/A = not available.
┼ Full references for the individual studies listed in this table are available in the Supplementary Material S1. Reference numbers in square brackets refer to the supplementary reference list.
Risk of bias assessment
Of the 109 included studies, 62 (56.9%) had low risk of bias (JBI score 7-9), 37 (33.9%) had medium risk (score 4-6), and 10 (9.2%) had high risk (score < 4). For more details on the critical appraisal of individual studies, please refer to Supplementary Table S2. The regression test for funnel plot asymmetry indicated asymmetry in all main and subgroup analyses except use in preclinical, clinical, and internship cycles, use in the U.S and Canada, use during the 1980s and 1990s, use in legalized areas, and use in private universities. Detailed results for each asymmetry analysis are provided in Supplementary Table S3 and Figure S1. However, the trim-and-fill method did not suggest any modifications, and the adjusted prevalence remained unchanged. This is likely because the identified asymmetry was not due to missing studies, but rather to other factors, such as the high heterogeneity observed across all analyses.
Prevalence of cannabis use
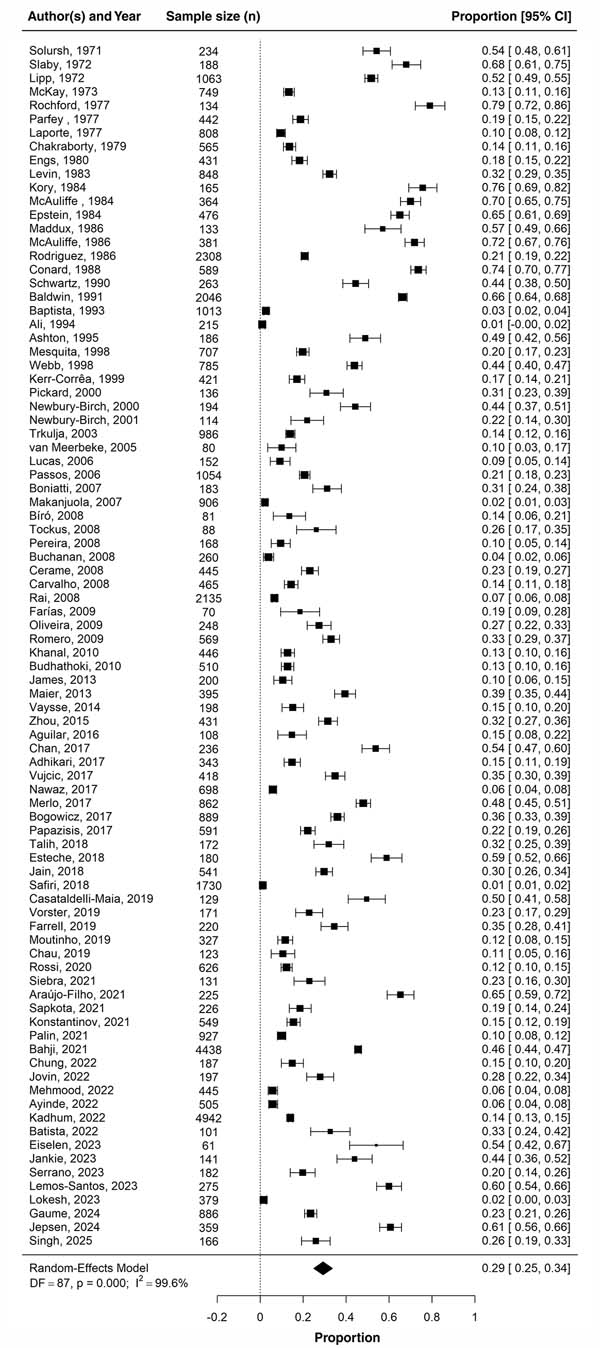
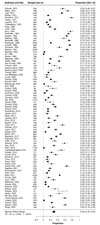
A meta-analysis of 88 studies estimated lifetime cannabis use at 29.2% (95%CI 22.9-33.6, I2 = 99.64) (Figure 2). Based on 38 studies, past-year use was 20.5% (95%CI 16.0-25.1, I2 = 98.68). Analysis of 45 studies showed past-month use at 9.2% (95%CI 7.2-11.2, I2 = 98.89), and data from 24 studies indicated a past-week use of 5.1% (95%CI 3.4-6.9%, I2 = 97.99). Supplementary Figures S2 to S4 illustrate the prevalence for past-year, past-month, and past-week cannabis use.
Temporal trends
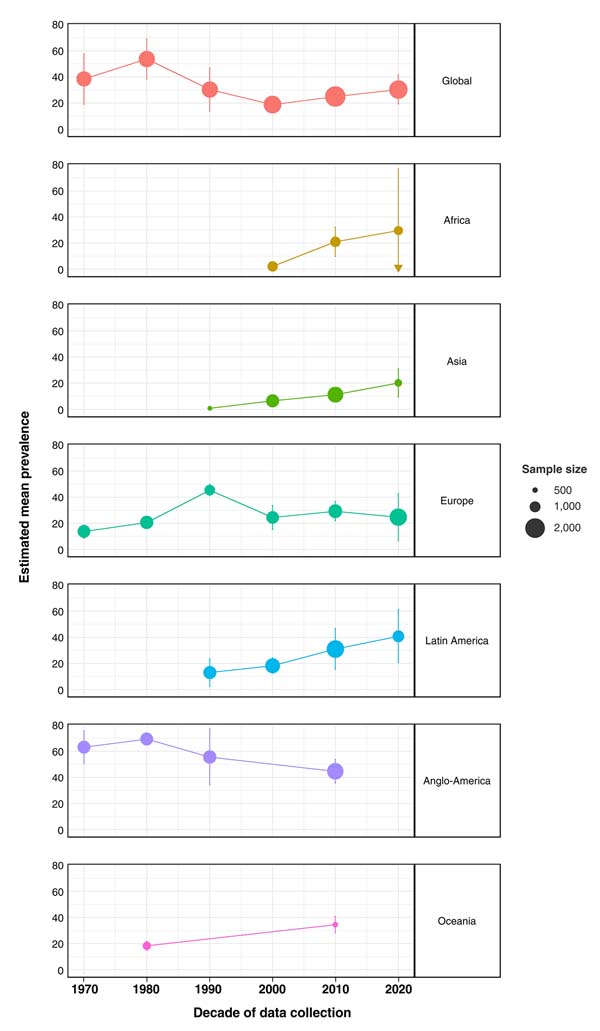
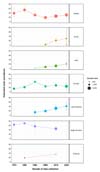
Lifetime cannabis use varied significantly across decades (p < 0.01, R2 = 18.16, I2 = 99.46%). A decreasing trend was observed, from 38.4% in the 1970s (from eight studies, 95%CI 19.2-57.7, I2= 99.63) to 18.7% in the 2000s (from 19 studies, 95%CI 13.6-23.8, I2 = 98.37), followed by an increasing trend, reaching 30.4% in the 2020s (from 14 studies, 95%CI 19.2-41.6, I2= 99.51). In contrast, a simple linear meta-regression using publication year as a continuous variable, while also statistically significant, showed only a slight negative association and explained a smaller portion of the variance (coefficient = -0.004; 95%CI -0.006 to -0.001; p < 0.01; R2 = 8.11; I2 = 99.59). The forest plots for the temporal trends are shown in Supplementary Figures S5 to S10.
Regional trends
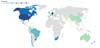
The subgroup analysis revealed differences in the prevalence of lifetime cannabis use across regions (p < 0.01, R2 = 52.48, I2 = 99.09): the prevalence was 11.5% in Asia (15 studies, 95%CI 7.1-15.8, I2 = 98.90), 22% in Africa (seven studies, 95%CI 9.0-34,9, I2 = 99.33), 26.2% in Oceania (two studies, 95%CI 10.3-42.1, I2 = 94.77), 26.1% in Europe (23 studies, 95%CI 20.4-31.7, I2 = 98.91), 25.2% in Latin America (25 studies, 95%CI 18.3-32.2, I2 = 98.90), and 59.7% in the United States and Canada (16 studies, 95%CI 53.1-66.3, I2 = 98.03). Figure 3 illustrates the global and regional trends across decades, while Figure 4 presents the pooled prevalence rates of different countries. The corresponding forest plots showing the prevalence for each region are presented in Supplementary Figures S11 to S16.
Legality and sociodemographic associations
Based on an analysis of nine studies, the prevalence of lifetime use in countries with liberal cannabis laws was 39.7% (95%CI 27.6-51.8. I2 = 98.76), compared to 27.7% from 77 studies in countries with strict laws (95%CI 23.1-32.4, I2 = 99.62). The difference between these groups was not statistically significant (p = 0.06, R2 = 2.75, I2 = 99.57).
In the analysis of the 38 studies that provided data stratified by sex, the prevalence of lifetime cannabis use was 31.2% among male students (95%CI 24.8-37.6, I2 = 99.05) and 22.9% among female students (95%CI 16.5-29.3, I2 = 99.70), without significant differences between these groups (p = 0.07, R2 = 2.92, I2 = 99.55).
Although there was no clear linear trend across study cycles (preclinical, clinical, internship) (p = 0.30, R2 = 1.05, I2 = 97.56), the highest point-estimate prevalence of use was observed during the internship cycle: 27.1% in the preclinical stage (from 17 studies; 95%CI 19.3 - 34.3, I2 = 97.39); 23.6% in the clinical stage, (from 10 studies; 95%CI 12.3-34.8, I2 = 98.29); and 35.7% in the internship stage, (from 10 studies; 95%CI 22.9-48.5, I2 = 96.37).
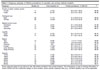
The subgroup analysis by institution type showed a prevalence of 23.5% in public universities (46 studies; 95%CI 18.7-28.4%, I2 = 99.48) and 30.2% in private universities (11 studies; 95%CI 20.7-39.6%, I2 = 96.99). The difference between them was not statistically significant (p = 0.2, R2 = 0.88, I2 = 99.38). Table 2 presents the detailed subgroup analyses of lifetime prevalence.
| Subgroup | Studies (k) | Total students (n) | Pooled prevalence, % (95%CI) | I2 |
|---|---|---|---|---|
| Private of public medical school | ||||
| Private | 11 | 2,733 | 30.2 (20.7-39.6) | 96.99 |
| Public | 46 | 23,187 | 23.5 (18.7-28.4) | 99.48 |
| Participant sex | ||||
| Male | 38 | 11,141 | 31.2 (24.8-37.6) | 99.05 |
| Female | 38 | 12,584 | 22.9 (16.5-29.3) | 99.70 |
| Medical school cycle | ||||
| Preclinical | 17 | 4,212 | 27.1 (19.3-34.9) | 97.39 |
| Clinical | 10 | 2,239 | 23.6 (12.3-34.8) | 98.29 |
| Internship | 10 | 1,259 | 35.7 (22.9-48.5) | 96.37 |
| Legality | ||||
| Legal | 9 | 6,733 | 39.7 (27.6-51.8) | 98.76 |
| Illegal | 77 | 37,563 | 27.7 (23.1-32.4) | 99.62 |
| Region | ||||
| Asia | 15 | 8,340 | 11.5 (7.1-15.8) | 98.90 |
| Africa | 7 | 3,232 | 22.0 (9.0-34.9) | 99.33 |
| Oceania | 2 | 651 | 26.2 (10.3-42.1) | 94.77 |
| Europe | 23 | 17,585 | 26.1 (20.4-31.7) | 98.91 |
| Latin America | 25 | 7,903 | 25.2 (18.3-32.2) | 98.90 |
| Anglo-America | 16 | 12,003 | 59.7 (53.1-66.3) | 98.03 |
| Decade | ||||
| 1970s | 8 | 4,183 | 38.4 (19.2-57.7) | 99.63 |
| 1980s | 9 | 5,695 | 53.8 (38.4-69.2) | 99.38 |
| 1990s | 8 | 5,636 | 30.4 (13.9-47.0) | 99.79 |
| 2000s | 19 | 8,334 | 18.7 (13.6-23.8) | 98.37 |
| 2010s | 30 | 15,886 | 25.0 (19.3-30.7) | 99.31 |
| 2020s | 14 | 9,980 | 30.4 (19.2-41.6) | 99.51 |
Some subgroup totals do not add up to the 109 articles included in the overall analysis. This discrepancy is due to missing information in certain articles and the multicenter design of some studies, where specific subgroup data (e.g., cannabis legality) may not be applicable.
DISCUSSION
In this systematic review and meta-analysis of 109 studies involving 62,444 medical students from 32 countries in six global regions, we examined the prevalence of cannabis use and explored temporal, regional, and sociodemographic trends. Six key findings emerged: 1) the prevalence of cannabis use among medical students appears to be considerable, with varying rates depending on the timeframe; 2) a U-shaped trend in cannabis use has occurred, decreasing between the 1980s and the 2000s and increasing again in the 2010s and 2020s; 3) the highest prevalence occurred in the U.S and Canada, while the lowest occurred in Asia; 4) there were no significant differences in prevalence according to sex, study cycle, or country-level legal status.
This study has several limitations. The data were derived from various screening tools, many of which were not validated and relied on self-reporting. To address this, future studies should utilize standardized, validated tools. Second, many studies lacked details on medical school curriculum and population characteristics, which complicated cross-country comparisons. Uniform reporting on these variables would enhance comparability. Additionally, some crucial information was missing, such as other clinical conditions and substance use disorders. Future studies should aim to collect comprehensive data on these factors. Finally, although the review included global data, much of the recent evidence originated from North America. Only two African countries - South Africa and Nigeria - were represented, which limits the generalizability of findings for this region. Similarly, only two studies from Oceania were included. Future research should prioritize underrepresented samples. Furthermore, the mean age of our sample (22.7 years) was lower than the average age of medical school matriculation in the United States (24 years).17 This discrepancy may reflect the inclusion of studies from countries with direct-entry medical programs, unlike the graduate school model in the United States, which should be considered when generalizing these demographic findings to this region. Limitations inherent to the review process should also be considered: due to the substantial statistical heterogeneity observed in most analyses, the pooled prevalence estimates should be interpreted with caution.
Our estimated lifetime prevalence of 29.2% aligns with Papazisis et al.12 but is lower than Naillon et al. (38%)13 and higher than the 11.5% prevalence found among nursing students,18 which indicates distinct use patterns among medical students. Importantly, medical students are a uniquely vulnerable group, facing high rates of depression, anxiety, burnout, suicidal ideation, and sleep disorders.19-22 These challenges may increase cannabis misuse, heightening their risk of psychiatric comorbidities and functional impairment,23 underscoring the need for targeted interventions and robust studies on the impact of this high prevalence.
To our knowledge, this is the most comprehensive meta-analysis of temporal trends in cannabis use among medical students. The temporal shifts in cannabis use, decreasing from 38.4% in the 1970s to 18.7% in the 2000s and then increasing to 30.4% by the 2020s, reflect a complex pattern. The initial decline may have been due to strict anti-drug policies and limited acceptance at the time. For instance, during the Reagan-Bush "War on Drugs" in the 1980s and 1990s, there was a significant decline in self-reported marijuana use in the United States, as noted by Caulkins.24 Similar to our findings, Caulkins observed a rise in self-reported cannabis use between 1992 and 2008, followed by substantial increases after 2008, likely driven by policy liberalization. Additionally, the COVID-19 pandemic may have contributed to the recent short-term upsurge in cannabis use due to increased overall substance use, including alcohol and cannabis, as a coping mechanism for the stress and emotional challenges of this period.25 While this trend may be temporary, the pandemic's negative impact on mental health, particularly among young adults and adolescents,26 could lead to lasting changes in substance use patterns. Despite the recent rise in prevalence, our meta-regression analysis, using publication year as a predictor, indicated a long-term decline in cannabis use. However, this trend may plateau or reverse, highlighting the need for continued monitoring and identification of underlying drivers. The observed long-term decline followed by signs of recent stabilization or modest increases parallels trends in adolescent cannabis use in the United States,27 yet contrasts with the ongoing decline in cigarette consumption.28 The legalization of recreational cannabis may influence usage among medical students by reducing perceived risk, increasing social acceptance, and enhancing availability, potentially leading to higher consumption among young adults.29-31 However, our meta-analysis does not support this, showing a prevalence of 39.7% and 27.7% in countries where recreational cannabis use is legal and illegal, respectively, a non-significant difference (p = 0.06). While legalization may increase use, it can also promote access to regulated sources and encourage better-informed consumption.28 Further studies are needed to assess the benefits and the risks of legalization.
Cultural and legal factors may shape medical students' attitudes toward cannabis use and their perception of its clinical applications, influencing their knowledge of its benefits and risks.32,33 Lifetime cannabis use among young adults is significantly higher in liberal, high-income countries than in restrictive regions, ranging from 27.3%-43.2% in Sweden (depending on the survey methods) to 12.6% in sub-Saharan Africa.34,35 Recent shifts in legalization and cultural attitudes, along with increased awareness of cannabis' therapeutic potential among medical students, despite limited official approval, may partly explain the higher prevalence in this population.
Geographically, this study revealed significant regional disparities in cannabis use. The prevalence in the United States and Canada reached 59.7%, five times higher than in Asia (11.5%) and more than double that of other regions. These findings align with a report by the United Nations Office on Drugs and Crime,1 which also highlighted global disparities in cannabis use, with North America reporting the highest annual prevalence. These differences may stem from cultural norms, the availability of cannabis, and legal frameworks. In many countries, including Nigeria, Singapore, Egypt, and Malaysia, cannabis use remains a criminal offense. Additionally, the smaller sample sizes from Oceania, Africa, and Asia may have contributed to the observed regional disparities, highlighting the need for more comprehensive data from underrepresented regions.
In contrast with previous studies, male sex was not associated with higher recreational cannabis use. This disparity, commonly reported in recreational cannabis studies, is hypothesized to be related to higher impulsivity, greater sensation-seeking behavior, and lower risk perception among men.36-39 Globally, men account for two-thirds of cannabis users, but the gap is narrowing in high-income countries, likely due to sociocultural shifts, including evolving social norms and increasing acceptance, which align with our results.1,40
Finally, cannabis use across different stages of medical education was examined, with the highest rates observed during the internship cycle (35.7%), likely due to increased stress and academic pressure. No significant differences were found between public and private universities (p = 0.27), highlighting the need for universal educational and support programs. Additionally, the medical school environment may influence cannabis use behaviors, which warrants further investigation.
In conclusion, this systematic review and meta-analysis identified a high prevalence of cannabis use among medical students, with over one-third reporting lifetime use. Notably, a historical reversal was observed, decreasing between the 1970s and the 2000s, followed by an increase in the 2010s and 2020s. Regional variability was significant, with the highest prevalence in the United States and Canada and greater use in countries where it has been legalized. These findings highlight the need for continued research using standardized methods to track trends and assess public health implications. Furthermore, they call for a proactive institutional response, emphasizing robust mental health support, objective strategies for preventing substance abuse, and the integration of a formal curriculum on the health implications and regulatory aspects of cannabis.
SUPPLEMENTARY MATERIALS
ACKNOWLEDGEMENTS
EK is supported by a scholarship from Fundação de Amparo à Pesquisa do Estado do Rio Grande do Sul (FAPERGS), granted to MSH. MSH is supported by the United States National Institutes of Health (grant R01MH120482 - postdoctoral research fellow at the Universidade Federal do Rio Grande do Sul [UFRGS]) and by the Wellcome Mental Health Data Prize, granted by the Wellcome Trust (award 226697/Z/22/Z). No authors received support from the cannabis, tobacco, alcohol, pharmaceutical, or other relevant cannabis-related industries.
 PDF
 Print
 Send this article by email
 How to cite this article
 Submit a comment
 Mendeley
 Pocket
 Share on Facebook
 Share on Twitter