


ABSTRACT:
OBJECTIVE: Positron emission tomography (PET) allows in vivo evaluation of molecular targets
in neurodegenerative diseases, such as Alzheimer's disease. Mild cognitive impairment
is an intermediate stage between normal cognition and Alzheimer-type dementia. In vivo fibrillar amyloid-beta can be detected in PET using [11C]-labeled Pittsburgh compound B (11C-PiB). In contrast, [18F]fluoro-2-deoxy-d-glucose (18F-FDG) is a neurodegeneration biomarker used to evaluate cerebral glucose metabolism,
indicating neuronal injury and synaptic dysfunction. In addition, early cerebral uptake
of amyloid-PET tracers can determine regional cerebral blood flow. The present study
compared early-phase 11C-PiB and 18F-FDG in older adults without cognitive impairment, amnestic mild cognitive impairment,
and clinical diagnosis of probable Alzheimer's disease.
METHODS: We selected 90 older adults, clinically classified as healthy controls, with amnestic
mild cognitive impairment, or with probable Alzheimer's disease, who underwent an
18F-FDG PET, early-phase 11C-PiB PET and magnetic resonance imaging. All participants were also classified as
amyloid-positive or -negative in late-phase 11C-PiB. The data were analyzed using statistical parametric mapping.
RESULTS: We found that the probable Alzheimer's disease and amnestic mild cognitive impairment
group had lower early-phase 11C-PiB uptake in limbic structures than 18F-FDG uptake. The images showed significant interactions between amyloid-beta status
(negative or positive). However, early-phase 11C-PiB appears to provide different information from 18F-FDG about neurodegeneration.
CONCLUSIONS: Our study suggests that early-phase 11C-PiB uptake correlates with 18F-FDG, irrespective of the particular amyloid-beta status. In addition, we observed
distinct regional distribution patterns between both biomarkers, reinforcing the need
for more robust studies to investigate the real clinical value of early-phase amyloid-PET
imaging.
Keywords: Positron emission tomography; amyloid; [11C]-labeled Pittsburgh compound B; perfusion; cerebral glucose metabolism; [18F]fluoro-2-deoxy-d-glucose; aging, neuroimaging.
FIGURES
| Received: November 22 2021; Accepted: March 14 2022 |
INTRODUCTION
Alzheimer's disease (AD) is the most common form of dementia.1 In addition to brain deposits of amyloid-beta (Aß) peptides, tau pathology and neuron loss are AD's pathological hallmarks. This degenerative disorder is associated with early neurovascular dysfunction, contributing to disease pathogenesis.2
Mild cognitive impairment (MCI) is an intermediate stage between normal cognition and Alzheimer-type dementia.3,4 Patients with MCI can be further categorized as amnestic (aMCI) or non-amnestic MCI.5 The most common form, aMCI, is associated with memory loss and increased risk of AD,6 having a biomarker profile generally closer to AD than non-amnestic MCI.7
Neurodegenerative processes have been extensively investigated using positron emission tomography (PET) tracers such as Pittsburg compound B (11C-PiB), which is used for in vivo detection of Aß plaques in the brain,8,9 and, [18F]fluoro-2-deoxy-d-glucose (18F-FDG), which is used to estimate neuronal injury and synaptic dysfunction.10,11
The binding of 11C-PiB to Aß in gray matter is specific and reversible, although white matter has a non-specific and non-saturable component, possibly due to its high lipid content, as well as a specific component due to affinity to the ß-sheet structure present in the myelin.12 Accordingly, when there is a pathological concentration of Aß plaques in the brain, PET images usually show variable levels of 11C-PiB uptake in cortical tissue. Therefore, 11C-PiB imaging has been validated as an amyloid biomarker for in vivo investigation of AD.8,13,14
However, in theory, 11C-PiB PET imaging may provide two types of clinical information: cerebral perfusion when the images are acquired during the first few minutes after intravenous administration, and Aß plaque accumulation when the images are obtained later. Thus, it may serve as a dual biomarker.9,15- 20
Early concentration of the Aß tracer 11C-PiB in PET images is mainly determined by cerebral blood flow and, hypothetically, should be correlated with 18F-FDG uptake, due to blood flow and metabolism coupling in the brain. Lipophilic tracers, such as 11C-PiB, usually have a high first-pass influx rate (K1),21 which correlates with the regional cerebral blood flow (rCBF) due to the high extraction fraction.22
Due to the phenomenon of flow-metabolism coupling, we would expect to find some degree of association between cerebral biodistribution of early 11C-PiB (11C-ePiB) and 18F-FDG PET .23- 25 Thus, 11C-ePiB might serve as a surrogate for tissue perfusion and, indirectly, brain metabolism.26,27
Prior evidence suggests that vascular dysfunction can lead to neuronal dysfunction and neurodegeneration. Such disorders include accumulation of the Aß peptide in the brain and the vessel wall, respectively, reflecting synaptic loss due to neuronal injury by AD.2 Some studies have shown that hypoperfusion and hypometabolism overlap in AD by detecting deficits in the posterior cingulate and posterior temporoparietal associative cortex.28- 30
Different groups have investigated the potential value of initial phase amyloid study to reflect rCBF. Reports have compared rCBF estimates derived from summed 11C-ePiB images and the washout allometric reference method for the R1 parameter in a standard reference tissue model. In general, these techniques are computationally demanding or only produce relative rCBF measures.31
Thus, considering the limited number of studies and their methodological differences, more research is clearly needed to investigate blood flow/metabolism coupling in specific brain regions using 11C-ePiB and 18F-FDG. This study aimed to explore the regional biodistribution differences between 18F-FDG PET and 11C-ePiB PET measured in an early-phase interval of 0-10 minutes in older adults without cognitive impairment, with aMCI, or with a clinical diagnosis of probable AD.
METHODS
Study population
Cognitively healthy volunteers and cognitively impaired subjects (with dementia compatible with AD or aMCI) were prospectively recruited at the Universidade de São Paulo's Hospital das Clínicas School of Medicine. This study was conducted in agreement with the 1964 Helsinki declaration and was approved by the institutional ethics committee (CAPPesq: n° 1.454.598). Written informed consent was obtained from all participants.
Ninety consecutive older adults were enrolled and divided into 3 main groups according to clinical and neuropsychological characteristics: 1) probable AD (n=27); 2) aMCI (n=39), and 3) cognitively healthy controls (n=24). All underwent full clinical evaluations, including structured interviews and a standardized comprehensive battery of neuropsychological tests.32- 36 A complete description of the patients can be found in Supplementary Text S1, available online only.
The final clinical diagnoses of either probable AD or aMCI were reached by a multidisciplinary consensus, considering the available clinical data gathered by neurologists, psychiatrists, and geriatricians. The patients met the 2011 National Institute of Neurological and Communicative Disorders and the Alzheimer's Disease and Related Disorders Association criteria for probable AD.37 The severity of cognitive decline was accessed using the Blessed Scale38 and the Portuguese version of the Mini-Mental State Examination (MMSE).39,40
The exclusion criteria were: age < 60 or > 90 years, history of diabetes mellitus, systemic disorders associated with cognitive decline, contraindications to performing magnetic resonance imaging (MRI), and brain lesions incidentally detected by MRI.
Image acquisition
All subjects underwent brain MRI and PET with a 1-month interval between the scans (30.0 [standard deviation, SD = 10.3] days). On average, 18F-FDG PET examinations were carried out 3.7 [SD = 0.7] days after acquiring the 11C-ePiB PET data.
T1-weighted MRI data acquisition
Anatomical MRI datasets were acquired using a Philips Achieva 3T scanner (software version 3.2.3/3.2.3.1; Philips Healthcare, Best, the Netherlands), at the hospital's radiology department, which was equipped with an 8-channel phased-array head coil according to the following protocol: T1-weighted datasets (3D) were acquired using the following parameters: TR 7 ms, TE 3.2 ms, flip angle 8o, Sense 1.5, field of view 240×240, matrix 240×240, 180 slices of 1 mm each with no gap, yielding a voxel size of 1×1×1 mm.
PET/CT data acquisition
Both the 11C-PiB and 18F-FDG tracers were produced on-site at the University's cyclotron facility (PETtraceT 880, GE Healthcare), which is compliant with good manufacturing practices. The PET images were acquired using a Discovery 710 PET/computed tomography (CT) scanner (GE Healthcare, Milwaukee, WI, USA) at the Nuclear Medicine Division of the Department of Radiology and Oncology.
According to the institution's standard protocol, a brain CT scan was performed immediately prior to the PET scan using the same scanner, which was used to correct attenuation. CT was performed using a 70-100 mA range, 120 kV, and 0.5 s per rotation, with a slice thickness of 3.25 mm.
11C-PiB PET. Dynamic imaging commenced at injection and continued for 70 minutes. Summed images were created with data from 0 to 10 minutes (early-phase 11C-ePiB) and 40 to 70 minutes (late-phase 11C-PiB) post-administration (565 [SD = 124] MBq). Both the dynamic frames and the summed images were converted to standardized uptake value images. The early phase of the dynamic sequence (i.e., first 10 minutes) was used to characterize cerebral blood flow, consistent with previous studies,41,42 while the latter phase was used to characterize amyloid burden. The static late-phase frame was reconstructed only for the clinical read-out of cerebral Aß pathology. The 11C-ePiB images were reconstructed using the following parameters: matrix 256×256 mm, iterative reconstruction method by ordered-subset expectation maximization, 24 subsets and 4 iterations, standardized processing algorithm (VUE Point HD) smoothed with Gaussian filter: full width at half maximum of 3 mm, and point spread function modeling (GE SHARP IR). The data were corrected for scattering, attenuation, dead time, and radioactive decay.
18F-FDG PET. Regarding 18F-FDG PET acquisition, participants fasted for a minimum of 6 hours. Blood glucose levels were measured and recorded immediately before 18F-FDG injection to ensure glucose levels below 200 mg/dL. The participants remained at rest without audiovisual stimuli and with their eyes open for at least 30 minutes after intravenous administration of 18F-FDG (212 [SD = 23] MBq). Data were acquired in static mode for 15 minutes with time-of-flight information and a 256 x 256 mm matrix. The data were reconstructed using the ordered-subset expectation maximization method (16 subsets and 4 iterations), with a standardized processing algorithm (VUE Point FX) smoothed with a Gaussian filter (full width at half maximum 3 mm) and point spread function modeling (GE SHARP IR). The data were corrected for scattering, attenuation, dead time, and radioactive decay.
Data processing
The T1-weighted MRIs were pre-processed with the manual skull-stripping technique, and extracerebral structures (e.g., skull, fat, venous sinuses) were removed with MRIcroT software, version April 4, 2011 (http://people.cas.sc.edu/rorden/mricro/mricro.html) to improve robustness.43,44
The data were further analyzed using Statistical Parametric Mapping (SPM) software, version 12 (Welcome Department of Imaging Neuroscience, Institute of Neurology, London, U.K.; http://www.fil.ion.ucl.ac.uk/spm), which was run on the MATLAB platform, version R2015a (The Mathworks Inc., USA; http://www.mathworks.com/index).
The PET images were co-registered to the T1-weighted MRI to voxel-based statistical analysis. All images were oriented manually to place the anterior commissure at the origin of the 3-dimensional Montreal Neurological Institute stereotaxic coordinate system. The T1-MRI datasets were then spatially normalized to standard Montreal Neurological Institute space using standard diffeomorphic anatomical registration through exponentiated lie algebra. The images were then parcellated into different tissue classes: gray matter, white matter, and non-brain voxels (such as the skull and cerebrospinal fluid), based on separate tissue probability maps for each tissue class using the segmentation approach processing pipeline in SPM.45 The algorithm was used to generate a study-specific template, and the resulting flow fields were generated by diffeomorphic anatomical registration through exponentiated lie algebra. PET images were spatially normalized to MNI space using subject-specific transformation obtained from the Montreal Neurological Institute. The procedure was specifically designed for this study to obtain a more precise between-subject anatomical overlap. Finally, the images were spatially smoothed with a Gaussian kernel at a full-width half-maximum of 8 mm.
Proportional scaling to the global mean was used to minimize between-subject variability. After the spatial transformations, the total brain radioactive uptake measurement was automatically obtained by SPM, given the mean counts of all voxels included in each participant's PET volume, thus obtaining absolute quantitative value results. To ensure that the analysis only included voxels that mapped cerebral tissue, we selected a default threshold of 0.5 for the mean uptake.
To perform a voxel-wise correlation between 11C-ePiB and 18F-FDG, we used the MARSeille Boîte À Région d'Intérêt Toolbox (MarsBaR, version 0.44). Volumes of interest (VOI) were grouped using a weighted mean approach (incorporating the number of voxels per meta-VOI) into prefrontal, orbitofrontal, parietal, temporal, anterior, and posterior cingulate cortices, and the precuneus.46 The values were defined as counts per voxel in each VOI, specifically in units of Bq/ml.
Datasets were evaluated individually through blinded visual inspection by two certified nuclear medicine physicians with more than five years of experience in the field. Further details can be found in Supplementary Text S2, available online only.
All subjects were classified individually in late-phase 11C-PiB PET as positive or negative based on visual interpretation assisted by the 3D-SSP semi-quantitative software (CortexID Suite® software, GE Healthcare), with a standardized uptake value ratio (SUVr) > 1.42 as the positivity criterion.
To quantify cortical Aß load, the SUVr of late-phase 11C-PiB were analyzed using PMOD 3.4 software (PMODTM Technologies Ltda., Switzerland), as has been previously described.33 In the PNEURO tool, 11C-PiB PET images were co-registered to a T1-weighted MRI of respective subjects, and brain parcellation was performed based on the HAMMERS atlas (83 regions) for generating different VOIs. Images were corrected for partial volume effect using the "VOI-based" correction method. After extracting the SUVr for all regions, we also generated a meta-VOI, combining values46 normalized to the whole cerebellum.47
Statistical analysis
Demographic data and clinical details were managed using the Research Electronic Data Capture method.48 Comparisons of continuous demographic variables across the groups were performed using one-way analysis of variance with Bonferroni correction for multiple comparisons. Statistical analyses were performed in SPSS version 17 and GraphPad Prism version 6.0.
Differences across scans were estimated in a voxel-by-voxel analysis using SPM. In each comparison, two t-statistic maps corresponding to opposite contrasts (decrease or increase of perfusion/uptake) were generated. Significant differences between the regional distribution of 11C-ePiB and 18F-FDG were tested. In addition, unpaired t-tests were applied to examine the differences between each pair of groups (probable AD vs. control; probable AD vs. aMCI, and aMCI vs. control) for each method.
In addition to the between-group comparisons mentioned above, we ran partial linear correlation analyses between voxel-wise means in meta-VOI to further investigate Aß deposition relationships.
The findings in these exploratory analyses were considered significant if they survived correction for multiple comparisons with the family-wise error method (pFWE = 0.05), and clusters were reported as significant when they surpassed this level: only clusters with a voxel size > 10 were considered. Moreover, these maps were inspected for clusters of differences (increase/decrease) using a significance threshold of p < 0.001 (uncorrected for multiple comparisons) (Z = 3.09). The anatomic location of each resulting cluster was determined using the Talairach and Tournoux Atlas coordinates,49 converted from Montreal Neurological Institute space, and projected onto a template cortical surface.
RESULTS
Sociodemographic description of the sample
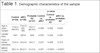
The sociodemographic data and MMSE scores of the 90 participants are shown in Table 1. Groups were paired by age and sex. Regarding years of education, there were imbalances between healthy controls and the aMCI group (p = 0.027) and between healthy controls and the probable AD group (p = 0.008). Significant differences in MMSE score were found between the three groups (p < 0.05), with the probable AD and aMCI groups performing worse than the control group, as expected.
| p-value | ||||||
|---|---|---|---|---|---|---|
| Control (n=24) | aMCI (n=39) | Probable AD (n=27) | Control vs. aMCI | Control vs. probable AD | aMCI vs. probable AD | |
| Age in years (range) | 71±6.2 (60-81) | 73±5.9 (62-86) | 74±7.7 (60-87) | 0.090 | 0.082 | 0.624 |
| Gender (f/m) | 19/5 | 29/10 | 18/9 | 0.670 | 0.328 | 0.505 |
| Years of formal education | 13±5.0 | 10±4.9 | 9±5.3 | 0.027* | 0.008* | 0.373 |
| MMSE scores | 28±1.4 | 26±2.3 | 21±3.8 | 0.001* | < 0.0001* | < 0.0001* |
Groups based on clinical classification. Data presented as mean ± standard deviation values (minimum-maximum).
f = female; m = male; MMSE = Mini-mental state examination; aMCI = amnestic mild cognitive impairment; AD = Alzheimer's disease.
The p-value corresponds to the results of one-way analysis of variance (ANOVA).
* p < 0.05.
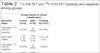
Regarding late-phase 11C-PiB PET, there was a significant mean difference in SUVr between the groups (Table 2). The receiver operating characteristic curve for SUVr is shown in Figure S1, available as online-only supplementary material. Even though we could not obtain very high receiver operating characteristic curves to distinguish the clinical groups, it was clear that late phase 11C-PiB is a good test for differentiating healthy adults from those with probable AD (area under the curve (AUC): 0.775[SD = 0.06]).
| Groups (based on clinical classification) | |||
|---|---|---|---|
| Biomarker status | Control (n=24) | aMCI (n=39) | Probable AD (n=27) |
| Late-phase 11C-PiB PET (positive) | 5 (21%) | 14 (36%) | 20 (74%) |
| Mean SUVr (range) | 1.55 (1.30-1.76) | 1.60 (1.16-2.12) | 1.70 (1.26-2.01) |
| Late-phase 11C-PiB PET (negative) | 19 (79%) | 25 (64%) | 7 (26%) |
| Mean SUVr (range) | 1.06 (0.94-1.22) | 1.08 (0.99-1.21) | 1.04 (0.95-1.17) |
| 18F-FDG PET (N +) | 1 (4%) | 11 (28%) | 20 (74%) |
| 18F-FDG PET (N -) | 23 (96%) | 28 (72%) | 7 (26%) |
Differences in biodistribution between early-phase 11C-PiB PET and glucose metabolism by 18F-FDG PET
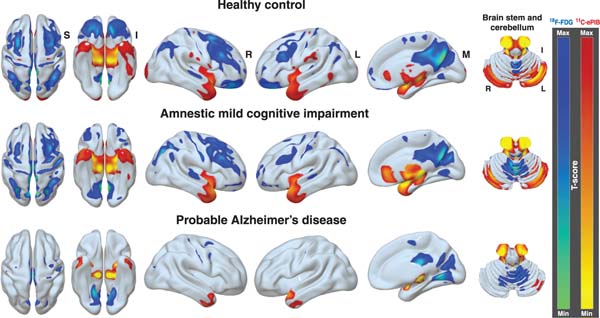
The first voxel-by-voxel analysis compared differences in regional cerebral uptake of 11C-ePiB and 18F-FDG within the groups, as shown in Figure 1.
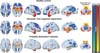
In the healthy control group, large areas of decreased 11C-ePiB perfusion compared to 18F-FDG uptake were seen bilaterally in the prefrontal, orbitofrontal, posterior parietal and superior temporal regions. The aMCI group had similar results, although to a lesser extent. The probable AD group had significant reductions in 11C-ePiB in the same regions, although to a much lesser extent than the other two groups. On the other hand, SPM analysis showed several clusters of increased 11C-ePiB perfusion relative to 18F-FDG uptake, especially in the anterior pole of both temporal lobes, as well as in the brain stem (mainly in the pons), cerebellum, anterior cingulate, and thalamus. Higher blood flow was observed relative to glucose uptake in the temporolimbic regions in the control and aMCI groups, although with some differences. Brodmann areas of the difference between the groups are detailed in Tables S1 and S2, available as online-only supplementary material.
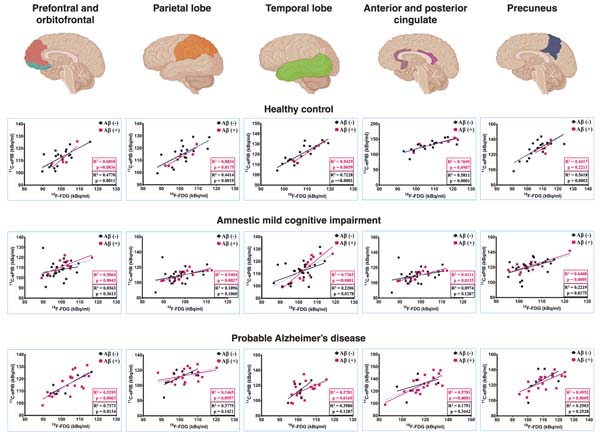
When exploring voxel-wise correlations, we analyzed the relationship of Aß status in the images (i.e., 11C-ePiB vs. 18F-FDG). A moderate positive relationship was found across all regions (prefrontal/orbitofrontal, parietal, temporal, anterior/posterior cingulate and precuneus regions). Figure 2 shows differences in the correlated locations.
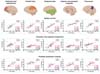
The healthy control group (Aß PET-negative) had widespread and stronger correlations in multiple locations than Aß PET-positive patients. Aß PET-negatives in the aMCI group showed a mild correlation. Widespread and weaker correlations were found in multiple Aß PET-negative patients than Aß PET-positive patients in the prefrontal/orbitofrontal, parietal, temporal and precuneus regions. Finally, there was a moderate to a strong relationship in prefrontal/orbitofrontal, anterior/posterior cingulate and precuneus regions between Aß PET-positive and Aß PET-negative patients in the AD group. No significant negative correlation was observed in the analysis.
Differences between 11C-ePiB and 18F-FDG in regional brain uptake among probable AD or aMCI patients compared to healthy controls
The differences between the probable AD and control groups are detailed in Table S3, available as online-only supplementary material, with years of education used as a covariate.
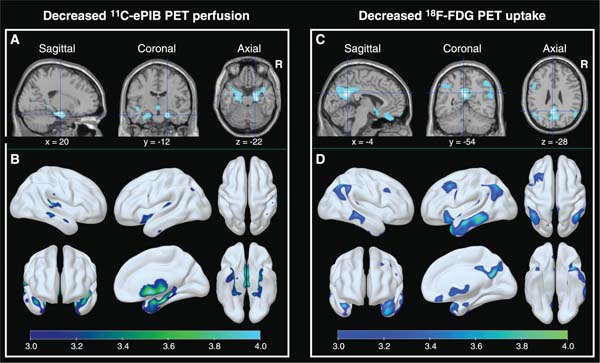
The probable AD group had lower 11C-ePiB perfusion than the control group in bilateral temporolimbic regions: parahippocampal gyrus (BA:36), hippocampus (BA:54), amygdala (BA:53) and the superior temporal gyrus (BA:38) (Figure 3A and B). The 18F-FDG analysis revealed significantly more voxels of decreased 18F-FDG uptake (lower metabolism) in the probable AD group than controls in the posterior cingulate cortex (BA:23) and precuneus (BA:31) (Figure 3C and D). A mild decrease in regional metabolic rate was also observed in the middle and inferior lateral temporal gyri (BA:39), but not in the mesial temporal and limbic structures.
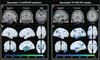
We performed a secondary analysis of PET images, corrected partial volume effects, and checked gray matter volumes between groups, the results of which are shown in Supplementary Text S3, Figures S2 and S3, available as online-only supplementary material.
The comparison of the aMCI and healthy control groups is detailed in Table S4 (online only), with years of education used as a covariate. The aMCI group had lower 11C-ePiB perfusion than the control group in the hippocampus and parahippocampal gyrus (Figure S4A and B, available as online-only supplementary material), which was similar, but to a much lower degree, than the results of the probable AD group (Figure 3A and B). However, no differences were observed in 18F-FDG uptake patterns between the aMCI and control groups.
Analysis of 11C-ePiB PET and 18F-FDG PET, based amyloid-ß biomarker status
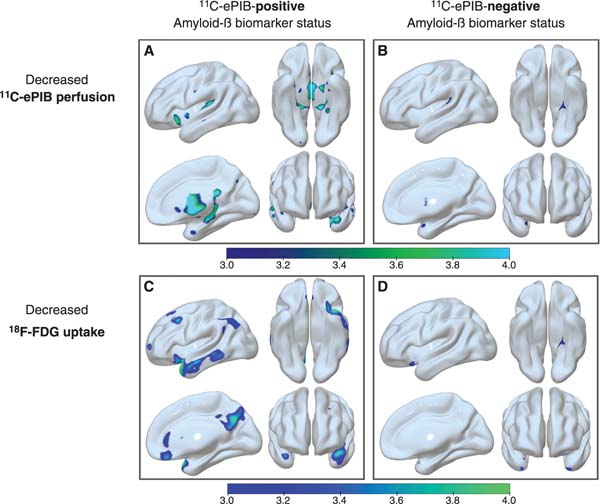
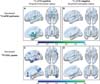
To determine whether amyloid burden status influenced the 11C-ePiB results, we used a consensus diagnosis, assigning the diagnostic category based on conventional 11C-PiB Aß phase analysis (late-phase images 40 to 70 minutes after injection). Through this categorical method, each individual was classified as positive or negative 11C-PiB PET, as previously described.33,34 A total of 34 patients with aMCI and probable AD were subcategorized as 11C-PiB-positive (aMCI, n=14 - probable AD, n=20), and 32 patients as 11C-PiB-negative (aMCI, n=25 - probable AD, n=7). We compared these groups with the healthy control group, which was 11C-PiB-negative (n=19). See Figure 4.
11C-PiB-positive patients vs. healthy controls
11C-ePiB perfusion was significantly lower in the bilateral mesial temporal structures: hippocampus (BA:54; coordinates: -22, 2, -30 - cluster size (kE): 74, pFWE: 0.001/BA:54; coordinates: 16, -38, -4 - cluster size (kE): 24, pFWE: 0.016), large cluster extending into other regions: parahippocampal gyrus (BA:36), amygdala (BA:53), and the superior temporal pole (BA:38). Moreover, 18F-FDG PET glucose metabolism was decreased in the posterior cingulate cortex and precuneus regions (BA:23; coordinates: -40, 10, -18 - cluster size (kE): 401, pFWE: 0.003; BA:31; coordinates: 0, -50, 34 - cluster size (kE): 12, pFWE: 0.038).
11C-PiB-negative patients vs. healthy controls
Individuals categorized as cognitively abnormal (aMCI and AD) but with negative 11C-PiB PET results did not show an abnormal decrease of 11C-ePiB perfusion or 18F-FDG uptake, unlike the results of cognitively impaired patients with positive 11C-PiB PET results.
DISCUSSION
The present study's main finding was that although 11C-ePiB and 18F-FDG provide complimentary, significantly correlated data, they are not the same across all disease groups. This supports our first hypothesis that 11C-ePiB PET can serve as a robust indicator of neurodegeneration in individuals with probable AD and aMCI. These results support the value of 11C-PiB as a bi-functional imaging biomarker, highlighting significant differences with metabolic imaging findings typically seen in 18F-FDG.
We found significant relationships between the images, showing significant interactions between Aß status (negative or positive). Despite the visual similarities between the images and the biodistribution pattern of each PET tracer, the probable AD group had reduced perfusion in areas that commonly show atrophy in volumetric MRI and autopsy studies (i.e., medial temporal lobes),50 but with preserved cerebral glucose metabolism.
These findings provide interesting insight into physiological and pathological brain aging. Although we selected a longer interval time frame for the perfusion phase of 11C-PiB (0 to 10 minutes) than other recent studies,31,51- 54 this did not seem to have compromised the comparison between these two molecular probes, since there were distribution differences among the three groups. Moreover, if the longer interval used in this study could somehow account for higher tissue concentrations of 11C-PiB, it would be hard to explain how probable AD and aMCI patients had lower uptake of 11C-ePiB in limbic structures than 18F-FDG. These regions are known to show increased fibrillar Aß burden in AD. Aß pathology progression seems to begin in the neocortex with a few diffuse plaques and then progresses to the hippocampus, entorhinal cortex, cingulate cortex, and amygdala.55
In the present study, comparisons across groups were conducted using both radiopharmaceuticals independently to determine whether different tracers show distinct signs of neurodegeneration in each phase of the AD spectrum. Patients with probable AD had lower 18F-FDG uptake than controls mainly in the posterior cingulate cortex (PCC) and default mode network nodes, while decreased 11C-ePiB perfusion was found in the superior temporal gyrus and limbic mesial temporal lobe areas, indicating distinct but complementary regions with reduced metabolism and perfusion.
Furthermore, compared to the aMCI and control groups, the probable AD group had relatively lower uptake of 18F-FDG than 11C-ePiB, especially in the PCC and the temporoparietal regions. This may suggest that uptake deficits in the posterior association cortex and PCC are more easily identified with 18F-FDG than with the perfusion phase of 11C-PiB. This finding was also replicated in the analyses, using the same biomarker between groups (Figures 1 and 3).
18F-FDG uptake seems closely related to glial activity in neuronal synapses.56 The lower relative concentration of 18F-FDG in the cerebellum compared to perfusion may be associated with the different density of glial cells in relation to neurons between the cerebral and cerebellar cortices. In primates, there is a lower glia/neuron rate in the cerebellum than in the cerebral cortex,57 probably explaining the lower relative 18F-FDG uptake in this area. The same phenomenon may occur in other human brain areas, which would at least partially explain uncoupling in regional blood-flow/metabolism.
In fact, given the large between-subject variability in the topography of the disease, understanding factors that explain variability in level and change over time in 11C-PiB retention may help differentiate between normal aging and cognitive impairment. CBF alterations and Aß accumulation have been independently linked to cognitive deficits in older adults at risk for dementia. Less is known about how CBF and Aß interact to affect cognition in cognitively normal older adults. Although regional decreases in CBF are interpreted as reflecting decreased brain function, increases in perfusion in the context of preclinical AD, particularly when cognitive performance is maintained or improved, has often been considered a compensatory response to an incipient pathological process.58,59
Of note, the main discriminatory factor between the groups was clinical diagnosis. We also found this to remain consistent when re-analyzed based on Aß biomarker status. There was a close relationship between decreased 11C-ePiB perfusion and 18F-FDG uptake only in the Aß 11C-PiB-positive group, but not in the Aß 11C-PiB-negative group, which suggests a possible interaction between Aß deposition and reduced rCBF. This led us to infer that non-significant Aß uptake in brain tissue might have impaired our 11C-ePiB results, since the findings of reduced "perfusion" remained when compared to the 11C-PiB-negative group, which did not have reduced 11C-ePiB perfusion in any brain region. Probable AD was strongly associated with amyloid positivity. There was a strong association between amyloid positivity and positive neurodegeneration patterns in the probable AD and aMCI groups, with the majority of amyloid-positive patients being classified as N+ in those two groups, particularly in those with an AD-hypometabolic pattern.
Nevertheless, we found decreased metabolism in the association cortex and posterior cingulate gyrus in our sample of probable AD patients, as well as in the 11C-PiB-positive group (probable AD and aMCI). Still, no deficit in "perfusion" (according to 11C-ePiB concentration) was seen in the same groups, again raising the question whether uncoupling would be more prevalent in the limbic structures than in the association cortex or PCC.
Our study's findings strengthen the hypothesis that 18F-FDG PET reflects activity in the default mode network, whereas 11C-ePiB PET probably does not. In 2014, Leech and Sharp showed that functional connectivity within the default mode network is reduced at AD onset, a change that mainly affects the connection between the PCC and the hippocampus. Altered patterns of functional connectivity of the PCC also reflect the genetic status of apolipoprotein E, a risk factor for AD.60 Reduced metabolism in the PCC is also associated with Aß deposition and brain atrophy in a spatial distribution that strikingly reflects the nodes of the default mode network.61
These findings were more pronounced in probable AD than in aMCI patients, as would be expected according to the theory of longitudinal progression. It raises the question of whether neurovascular uncoupling is related to upregulation of metabolism in areas that have suffered from continuous neuronal loss and brain atrophy, as is usually seen in patients with AD. Depending on the status of the compensatory mechanism, the glucose metabolic rate in patients with AD may initially increase and then subsequently decrease,62 which could explain the findings of reduced perfusion in mesial temporal structures (in 11C-ePiB images) but no changes in 18F-FDG uptake in the same regions.
Several authors have reported28,29,63,64 that decreased metabolism in the PCC is an early sign of AD and may result in a decline of cognitive function over time. While hypometabolism in the temporoparietal and PCC is a reliable predictor of progression to AD, this pattern has also been reported in patients with aMCI. However, in our sample of aMCI patients, no differences were observed in regional perfusion/uptake of both tracers compared to healthy controls. As shown in Figure 3, it was intriguing to find more significantly reduced perfusion of 11C-ePiB in the mesial temporal lobes rather than a greater reduction of glucose metabolism in the PCC in patients with probable AD. Again, this may suggest that the 0-to-10-minute interval chosen to represent the earliest perfusion status of 11C-PiB was unaffected by cortical retention ratios of Aß deposition.
The main differences in regional uptake between 18F-FDG PET and 11C-ePiB PET images were observed in subcortical and white matter regions (lower metabolism), whereas 11C-ePIB PET showed lower cortical perfusion than 18F-FDG PET in several large clusters. In all groups, we found dissociations in specific regions, such as the corticospinal tract, cerebellum, and thalamus, which had higher relative perfusion of 11C-ePiB than 18F-FDG uptake.
The dissociation patterns may reflect the differences between tracer properties and biodistribution patterns. While the basis for increased 11C-PiB uptake in white matter is unknown, it is associated with higher lipid composition, slower blood perfusion rate and, hence, slower delivery of the radioligand and clearance rates than gray matter.14,65 White matter uptake is commonly observed in amyloid-PET studies using different Aß tracers, independent of cortical Aß deposition, both in cognitively impaired and unimpaired individuals.66 Furthermore, the finding that Aß has different associations with rCBF and volume is consistent with the view that functional and synaptic loss is an early event in Alzheimer's disease, leading to reduced rCBF prior to gray matter loss.67
A recent article68 suggests that regional measures of 11C-PiB, particularly the relative delivery parameter R1 computed from dynamic 11C-PiB, can be a valid surrogate index of rCBF. This dual-imaging property may obviate additional 18F-FDG PET scanning, thereby reducing patient investigation time, radiation exposure, and, especially, cost.68 Moreover, other earlier 11C-PiB times that better corresponded with the influx of the tracer into the brain have resulted in high-quality rCBF images comparable to those obtained by 18F-FDG SUVr.53,54
Another exciting possibility is additional comparative clinical studies with arterial spin labeling perfusion MRI, which uses magnetically labeled arterial blood water as a tracer and yields very similar image patterns and comparable diagnostic accuracy to 18F-FDG PET. Significant positive correlations between CBF and cognition have been detected using arterial spin labeling perfusion MRI. These correlations may support the idea that rCBF could be a biomarker of neural changes due to cognitive decline.69
A previous study26 found that an optimal relative quantitative analysis of early-phase 18F-florbetaben acquisitions arises from global mean normalization, with little effect from the particular time frame (0-5 or 0-10 min). The 18F-florbetaben uptake in the first ten minutes post-injection yields a perfusion-like image, evidently serving as a valid surrogate marker for synaptic and metabolic dysfunction, which would otherwise be revealed in a separate 18F-FDG PET scan.
The potential advantage of using different temporal phases of 11C-ePiB concentration in brain tissue to provide distinct functional information has been investigated previously with intriguing results. Discrepancies between our findings and those of other studies may be attributable to a series of factors, including selection criteria, demographics, the inclusion of other dementia syndromes, disease severity, etc. In an attempt to determine the optimal time frame for representing perfusion through 11C-ePiB data, a previous study15 found a high correlation between perfusion, measured in minutes 1-8 of an 11C-PiB PET scan, and metabolism, measured by 18F-FDG PET, although it enrolled a relatively small cohort of subjects who had a variety of neurodegenerative disorders. Of note, no relationship was found between quantitative measures of a 1-8 minute interval (no distinction between 11C-PiB-positive and 11C-PiB-negative groups).53,54 Furthermore, we found other earlier 11C-PiB times that better corresponded with tracer influx and resulted in high-quality rCBF images comparable with those obtained by 18F-FDG SUVR (standardized uptake value ratios).53,54 Gietl et al. found no associations between 11C-ePiB frames and Aß positivity. Another study16 that included AD and MCI patients reported lower values of 11C-ePiB in the 11C-PiB-positive group than the 11C-PiB-negative group in the posterior cingulate cortex and parietal cortex, whereas there were widespread differences in 18F-FDG in cortical and subcortical gray matter.
Our arbitrary determination of a 0-10-minute interval for 11C-ePiB images, which was considered to represent the cerebral blood flow/perfusion distribution pattern of this particular tracer, could be mentioned as one limiting factor. Most published data so far has only included images acquired up to 8 minutes after injection. However, it would be hard to say that adding 2 more minutes (considering 10 minutes as the threshold) might have compromised the main concept and hypotheses of this study. Theoretically, adding further statistics to the summed images could have resulted in a more adequate visual and quantitative analysis.
In the present study, we did not validate the concept of 11C-ePiB perfusion using other methodologies or imaging biomarkers, such as 15O-H2O PET or even brain perfusion SPECT, to prove that we were observing the same physiological phenomena. We assumed that the early phases could represent blood perfusion through the volume distribution of 11C-PiB in brain tissue, without significant attachment to Aß plaques.
One potential benefit of using a single biomarker imaging study to provide dual-function data is that it would reduce overall patient investigation time, radiation exposure, and further costs. However, cost-effectiveness analysis should determine whether excluding 18F-FDG PET and adding early and late phase amyloid imaging would reduce the overall cost without compromising accuracy.
In conclusion, our study suggests that images obtained from 0 to 10 minutes during the early phase of 11C-PiB uptake correlate with 18F-FDG, irrespective of amyloid status. However, distinct regional distribution patterns between both biomarkers were seen in individuals with probable AD and aMCI, reinforcing the need for more robust studies to investigate the real clinical value of early-phase amyloid-PET imaging.
ACKNOWLEDGMENTS
This study was supported by the São Paulo Research Foundation (FAPESP: number 2012/50329-6). The authors would like to thank all of our patients and their caregivers for making this study possible. The Departments of Neurology and Psychiatry at the University of São Paulo Hospital das Clínicas School of Medicine. Special thanks to Douglas dos Santos Picolo for support during neuroimaging data collection.
Disclosure
The authors report no conflicts of interest.
 PDF
 Print
 Send this article by email
 How to cite this article
 Submit a comment
 Mendeley
 Pocket
 Share on Facebook
 Share on Twitter