


ABSTRACT:
OBJECTIVES: To provide practical norms for measuring depressive symptoms with the Patient Health
Questionnaire 9 (PHQ-9) in Brazil through a state-of-the-art psychometrics analysis.
METHODS: We used a large representative dataset from the 2019 Brazilian National Health Survey
(Pesquisa Nacional de Saúde - 2019), which included 90,846 Brazilian citizens. To
assess scale structure, we assessed a unidimensional model using confirmatory factor
analysis. Item response theory was used to characterize the distribution of depressive
symptoms. Summed- and mean-based PHQ-9 scores were then linked using item response
theory-based scores in generalized additive models. Finally, percentiles, T scores,
and a newly developed score, called the decimal score (D score), were generated to
describe PHQ-9 norms for the Brazilian population.
RESULTS: Confirmatory factor analysis revealed a good fit to the unidimensional model, being
invariant to age and sex. Item response theory captured item-level information about
the latent trait (reliable from 1 to 3 SDs above the mean). Brazilian norms were presented
using summed scores, T scores, and D scores.
CONCLUSION: This is the first study to determine Brazilian norms for the PHQ-9 among a large representative
sample using robust psychometric tools. More precise PHQ-9 scores are now available
and may be widely used in primary and specialized clinical care settings.
Keywords: Psychometrics; depression severity; community psychiatry; measurement-based care.
FIGURES
| Received: November 03 2022; Accepted: February 22 2023 |
INTRODUCTION
Major depressive disorder is the second leading contributor to the chronic disease burden,1,2 affecting approximately 4% of the Brazilian population (8.5 million citizens).3 Measuring depressive symptoms accurately, both for identifying the disorder and tracking the benefits and harms of interventions, is one of the most important challenges that health providers face when dealing with this condition.4 The present study provides norms that can facilitate depressive symptom assessment in Brazilian populations based on data from a nationally representative sample and using one of the most common instruments in the literature: the 9-item Patient Health Questionnaire (PHQ-9).
The PHQ-9 is a 9-item module of the PHQ instrument, which was developed to screen and diagnose patients with depressive disorders in primary care.5,6 Systematic reviews have shown that the instrument has good diagnostic accuracy, stressing its usefulness in primary care.7 Previous studies investigating the PHQ-9's psychometric proprieties in Brazilian populations have found good performance among women in primary care,8 older adults,9 and adults in the general population.10 In addition to psychometric proprieties, it is also important to provide normative data for national use in primary care,11 as well as to determine whether the data are stable across groups (i.e., sex and age). Countries such as South Korea12 and Germany13 have already developed norms for using the PHQ-9 in their populations to facilitate the usefulness, meaningfulness, and comparability of its results.
However, the literature is limited in a number of important ways. No Brazilian norms for the PHQ-9 have been derived from a large nationally representative sample, which makes it difficult for clinicians to understand the meaning of PHQ-9 scores for individual patients. For instance, it is not clear whether PHQ-9 scores should be adjusted for age and sex (i.e., whether raw measures are comparable across different demographics), and finally, which score format provides the clearest interpretation. Scores can be classified in several ways, including percentiles ranks, z scores and T scores.14 However, because they can be difficult to interpret, new ways of presenting the psychometric data are called for. In this study, we developed the D score, which may be an easier implementation method in Brazilian primary care due to its simple, comprehensible range (0-10).
In the present study, we aimed to address these limitations by creating Brazilian norms for the PHQ-9, investigating measurement invariance across distinct demographic groups. We also aimed to report PHQ-9 norm scores with a promising strategy, the decimal score (D score). This score can help clinicians communicate clinical decisions to patients, which may enhance daily use of measurement-based approaches. The D score (with a mean of 5 and an SD of 2) was chosen for the present study because it is used in the national educational system. All analyses were performed with data from the 2019 Brazilian National Health Survey (Pesquisa Nacional de Saúde [PNS-2019]),15 a large and representative nationwide study involving 90,846 citizens. The PNS-2019 provides information for a number of governmental and nongovernmental agencies.
METHODS
This cross-sectional study used the PNS-2019 database,15 a large Brazilian household survey designed in partnership with the Brazilian Institute of Geography and Statistics (Instituto Brasileiro de Geografia e Estatística), a government agency.16
Participants and data collection
The sample included 90,846 participants (95.5% of the total PNS-2019 sample of 94,114), aged = 15 years (52.8% female). The PNS-2019 data were collected between August 2019 and March 2020 from residents of permanent households, excluding those in special census tracts or scarcely populated areas. Interviewers, supervisors, and coordinators were trained by senior Brazilian Institute of Geography and Statistics personnel and continuous supervision was provided. Households and residents were selected by simple random sampling.15,16 Two or more visits were planned for each household. After randomly selecting an address, a visit was scheduled, and a respondent aged = 15 years was randomly selected for an individual interview.
9-item Patient Health Questionnaire
Developed in 19945 and first validated in 1999,6 Spitzer et al. aimed to create a depression screening and diagnostic tool for primary care, which resulted in the PHQ's 9-item mood module. The PHQ-9 is an ordinal scale that asks patients to rate the frequency of specific symptoms they have experienced over the past 2 weeks on a scale of 0 to 3: 0 = not at all, 1 = several days, 2 = more than half of the days, and 3 = nearly every day. For each item, patients are asked to indicate how frequently they have experienced the symptom by selecting a response from the scale. The points for each item are summed for a total score, which can range from 0 to 27, with higher scores indicating more severe depressive symptoms. In meta-analysis, the PHQ-9's sensitivity was 0.77 (0.71-0.84) and specificity was 0.94 (0.90-0.97), and its positive predictive value was 59% for major depressive disorder.7 In a Brazilian population,10 its sensitivity was 77.5 (61.5-89.2) and specificity was 86.7 (83.0-89.9). The Cronbach's alpha from the original validation studies was excellent (0.89).17 The Brazilian Portuguese version of the PHQ-9 was validated for use in primary care settings, also showing adequate psychometric proprieties.8
Statistical analysis
Statistical analysis comprised a stepwise procedure to: 1) confirm unidimensionality and internal consistency with confirmatory factor analysis (CFA) (Supplementary Methods); 2) test the scale's invariance across sex and age groups; 3) to test the scale's characteristics, information, and individual items using item response theory (IRT); and 4) to generate common metrics. P < 0.05 was considered statistically significant in all tests.
We first confirmed the structure of the PHQ-9 using CFA, which was performed using delta parameterization and weighted least squares with a diagonal weight matrix and standard error and mean- and variance-adjusted chi-square statistics. To evaluate global model fit, we used root mean square error of approximation (RMSEA), comparative fit index (CFI), Tucker-Lewis index (TLI), and standardized root mean-square residual (SRMR). RMSEA values < 0.060 and CFI or TLI values > 0.950 indicate a good-to-excellent model. SRMR = 0.100 indicate adequate fit, and values < 0.060 in combination with previous indices indicate good fit (Hu & Bentler, 1999). Internal consistency was assessed using McDonald's omega coefficient (?). It estimates the proportion of a modelled factor's variance divided by the total variance, where factor loadings vary. This is appropriate for measuring internal consistency, especially in congeneric measures (i.e., when items do not have equal relations with the construct). ? ranges from 0 to 1; the closer to 1, the more the sum of its items measures the same construct.18,19
After CFA, we tested the PHQ-9's measurement invariance according to sex and age groups using ordinal multigroup CFA data.20 We tested whether the PHQ-9 is structurally similar among groups (configural invariance), if its items characterize symptom severity at an equivalent level (i.e., its items are constrained to be equal across groups: weak invariance). and whether its items are equally correlated with latent factors (additionally constraining factor loadings to be equal across groups: strong invariance). A ?CFI < 0.01, supplemented by ?RMSEA < 0.015 or ?SRMR < 0.010, between nested models with increasing levels of constraint indicates that the mean level differences between groups are due to differences in the latent trait (i.e., depression) and not to other sources of variation (Chen, 2007; Svetina, Rutkowski, & Rutkowski, 2020). When invariance was determined, we compared median levels between groups using the Kruskal-Wallis and Wilcoxon tests to estimate differences between pairs of groups using reference groups (females for sex comparisons, 15-19-year-olds for age comparisons, and the sample median for interstate comparisons). For Wilcoxon tests, the p-values were adjusted using the Benjamini-Hochberg method. We used H-statistics to calculate eta-square (2) effect size (0.01 to < 0.05 was considered a small effect, 0.06 to 0.13 a moderate effect, and = 0.14 a large group effect).
We then used two-parameter (item discrimination and difficulty) IRT with a graded response model for polytomous data to characterize depressive symptom distribution by generating an IRT-based score for each subject. The advantage of IRT-based scores is that they consider the distinct contributions of each item and have a near-normal distribution, with a mean of 0 and a variance of 1 (z score). We estimated the item information curve (IIC) and the item characteristic curve (ICC) to determine the severity level of the depression construct that the PHQ-9 is discriminating (IIC) and how response options are working to capture the information (ICC). These curves are based on a two-parameter IRT model in which parameter a is item discrimination and ß is item difficulty. Parameter a represents the rate at which the probability of a response category changes, given the construct level. The ICC slope is constant for all categories of the same item. Item discrimination helps differentiate individuals with similar levels of the latent construct (e.g., depression) since it marks where, in the latent construct, the probability of a positive response to certain items increases. Parameter ß indicates a 50% probability of a higher response to a given category in the latent construct (i.e., t threshold) in each PHQ-9 item (e.g., "not at all" vs. "several days"). Thus, it determines the construct level necessary to change from one category to another. Parameter ß is calculated by t/?, in which ? is the standardized factor loading of a given item. IIC is calculated by multiplying the probability of endorsing a response category by the probability of not endorsing it, which is represented in the y-axis. The apex of the information curve is the location of parameter ß (x-axis). IIC represents each item's ability to provide information about the latent depression construct and discriminate items that are more important for capturing the information. ICC depicts parameter a in the slopes of each response category curve, the probability of endorsing a given category (y-axis), and parameter ß (x-axis). IIC and ICC are relevant because they can indicate whether items identify individuals at the upper end rather than the lower end of the construct (i.e., people with higher rather than lower levels of depression).
We then generated percentiles, and T and D scores. The T score was calculated directly from factor scores using the formula 50 + (factor score*10). Using T scores, we were able to classify our sample according to depression severity, based on Patient-Reported Outcomes Measurement Information System (PROMIS) recommendations (an international effort to promote a common metric across instruments), i.e., none to slight, moderate, or severe.21 We compared the results with Brazilian depression cutoffs for the Mini-International Neuropsychiatric Interview (Santos et al.)10 and the original PHQ-9 (Kroenke et al.).17 The D score was calculated to produce a depression score from 0 to 10, characterizing distribution in a way that is friendly to clinicians and the general public alike. The D score was calculated using the formula 5 + (factor score*2). It was then rescaled according to the range of each T score-based severity category. Within each category, values were truncated (e.g., a D score of 3.02, the lowest score in the "none" category, becomes 0, while 5.45, the highest score in the category, is divided by 4 [the number of response options]; this yields 1.4 for the first category and 1.4 for the second category, which adds up to 5.5). Finally, we linked summed PHQ-9 scores with IRT-based scores by grouping factor, T, D scores, and percentiles, with each summed PHQ-9 score value.
CFA was carried out using the R package lavaan22 and reliability was calculated using the semTools packages.23 IRT calculations were performed in the R package ltm.24 Basic classical test theory statistics and scree plots were generated using the R package psych. Depression levels among groups (sex, age groups, and states) were compared using the Kruskal-Wallis test. All age groups were compared to the youngest group (15-19-year-olds). Individual states were compared to mean national PHQ-9 scores.
Ethics statement
The PNS-2019 was approved by the national research ethics committee (protocol 3.529.376).
RESULTS
The unidimensional model presented a good fit to the data (RMSEA = 0.060, 90%CI = 0.059 to 0.061; CFI = 0.992; TLI = 0.989; SRMR = 0.052) and adequate internal consistency (? = 0.875), meaning that the PHQ-9 measures a unidimensional construct and the sum of its items result in a consistent construct. The PHQ-9 was invariant across sexes (Table S1), age groups (Table S2), and states (Table S3), demonstrating that differences in PHQ-9 scores among these groups are derived from differences in the depression construct. Mean PHQ-9 scores differed significantly between sexes (?2[1] = 4357.9; p < 0.001; ?2 = 0.047), age groups (?2[13] = 190.8; p < 0.001; ?2 = 0.002), and states compared with the sample's mean (?2[27] = 751.8; p < 0.001; ?2 = 0.004), but with small effect sizes. Complete results for the PHQ-9 according to sex, age group, and state are shown in Table S4.
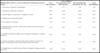
IRT analysis was used to characterize the distribution of depressive symptoms at the trait level. Full IRT results can be seen in the supplementary material (Figure S1 for IIC and Table 1 for item-level description of parameters a and ß). Overall, in this representative Brazilian sample, the PHQ-9 captured information about the most severe level of depression, with items 3 and 7 being the most informative (Table S2 and Table 1). In all items, the response "more than half of the days" had a low probability of capturing information (Table S3, Figure S2).
| ß (item difficulty) | ||||
|---|---|---|---|---|
| PHQ item (How often have you been bothered by the following in the past 2 weeks?) | Not at all=several days | Several days=more than half of the days | More than half of the days=nearly every day | a (item discrimination) |
| 1 - Little interest or pleasure in doing things? | 0.553 | 1.371 | 1.781 | 1.556 |
| 2 - Feeling down, depressed, or hopeless? | 0.431 | 1.369 | 1.808 | 2.241 |
| 3 - Trouble falling or staying asleep, or sleeping too much? | 0.679 | 1.545 | 1.954 | 2.938 |
| 4 - Feeling tired or having little energy? | 0.986 | 1.757 | 2.199 | 2.547 |
| 5 - Poor appetite or overeating? | 1.124 | 1.870 | 2.388 | 1.817 |
| 6 - Feeling bad about yourself - or that you are a failure or have let yourself or your family down? | 1.176 | 1.891 | 2.357 | 2.191 |
| 7 - Trouble concentrating on things, such as reading the newspaper or watching television? | 0.729 | 1.532 | 1.962 | 2.934 |
| 8 - Moving or speaking so slowly that other people could have noticed? Or so fidgety or restless that you have been moving a lot more than usual? | 1.180 | 1.853 | 2.268 | 2.695 |
| 9 - Thoughts that you would be better off dead, or thoughts of hurting yourself in some way? | 2.148 | 2.718 | 3.132 | 2.199 |
Parameters a and ß are described above in the text.
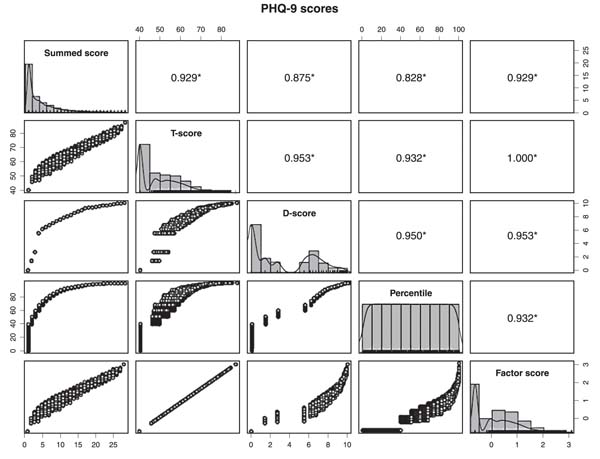
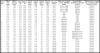
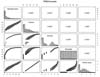
IRT-based factor scores for each participant were linked with summed T and D scores, as shown in Table 2. In the present sample, PHQ-9 scores = 16 represented severe depression in distributional terms, given that these people had T scores > 70 (97th percentile and a factor score > 1.77). Figure 1 shows the high correlation among total PHQ-9 scores, T and D scores, percentiles, and latent factor scores, as well as the distribution of each score in the sample. The strong and highly significant correlation among all scoring methods highlights their similarity for investigating depressive symptoms in this sample.
| PHQ-9 Sum | PHQ-9 sum mean | PHQ-9 factorial mean | PHQ-9 SD | PHQ-9 SE | T score PHQ-9 mean | T score PHQ-9 SD | D score PHQ-9 mean | D score PHQ-9 SD | Percentile PHQ-9 | Depressive symptom severity (PROMIS bands) | Original PHQ-9 classification (Kroenke et. al.17) | PHQ balanced screening rule according to MINI (Santos et. al.10) |
|---|---|---|---|---|---|---|---|---|---|---|---|---|
| 0 | 0.00 | -0.66 | 0.00 | 0.00 | 40.12 | 0.00 | 0.0 | 0.00 | 20.01 | None to slight | Minimal | Negative |
| 1 | 0.04 | -0.07 | 0.10 | 0.00 | 47.61 | 1.31 | 1.4 | 0.26 | 45.31 | None to slight | Minimal | Negative |
| 2 | 0.07 | 0.21 | 0.16 | 0.00 | 51.07 | 2.02 | 2.7 | 0.40 | 55.32 | None to slight | Minimal | Negative |
| 3 | 0.11 | 0.30 | 0.26 | 0.00 | 52.27 | 3.26 | 5.5 | 0.65 | 63.71 | None to slight | Minimal | Negative |
| 4 | 0.15 | 0.54 | 0.18 | 0.00 | 55.27 | 2.27 | 6.1 | 0.45 | 70.75 | Mild | Minimal | Negative |
| 5 | 0.18 | 0.70 | 0.16 | 0.00 | 57.22 | 2.05 | 6.4 | 0.41 | 75.90 | Mild | Mild | Negative |
| 6 | 0.22 | 0.78 | 0.20 | 0.00 | 58.30 | 2.54 | 6.7 | 0.51 | 80.16 | Mild | Mild | Negative |
| 7 | 0.26 | 0.93 | 0.16 | 0.00 | 60.18 | 2.02 | 7.0 | 0.40 | 83.81 | Moderate | Mild | Negative |
| 8 | 0.30 | 1.03 | 0.14 | 0.00 | 61.44 | 1.81 | 7.3 | 0.36 | 86.68 | Moderate | Mild | Negative |
| 9 | 0.33 | 1.10 | 0.17 | 0.00 | 62.34 | 2.09 | 7.5 | 0.42 | 88.95 | Moderate | Mild | Negative |
| 10 | 0.37 | 1.21 | 0.13 | 0.00 | 63.78 | 1.68 | 7.8 | 0.34 | 90.87 | Moderate | Moderate | Positive |
| 11 | 0.41 | 1.32 | 0.11 | 0.00 | 65.15 | 1.41 | 8.0 | 0.28 | 92.45 | Moderate | Moderate | Positive |
| 12 | 0.44 | 1.40 | 0.13 | 0.00 | 66.05 | 1.61 | 8.2 | 0.32 | 93.69 | Moderate | Moderate | Positive |
| 13 | 0.48 | 1.50 | 0.10 | 0.00 | 67.34 | 1.28 | 8.5 | 0.26 | 94.84 | Moderate | Moderate | Positive |
| 14 | 0.52 | 1.59 | 0.09 | 0.00 | 68.52 | 1.17 | 8.7 | 0.23 | 95.79 | Moderate | Moderate | Positive |
| 15 | 0.55 | 1.68 | 0.10 | 0.00 | 69.66 | 1.21 | 8.9 | 0.24 | 96.60 | Moderate | Moderately severe | Positive |
| 16 | 0.59 | 1.78 | 0.08 | 0.00 | 70.88 | 1.02 | 9.2 | 0.20 | 97.19 | Severe | Moderately severe | Positive |
| 17 | 0.63 | 1.86 | 0.09 | 0.00 | 71.94 | 1.09 | 9.3 | 0.22 | 98.00 | Severe | Moderately severe | Positive |
| 18 | 0.66 | 1.97 | 0.09 | 0.00 | 73.30 | 1.17 | 9.3 | 0.23 | 98.33 | Severe | Moderately severe | Positive |
| 19 | 0.70 | 2.06 | 0.09 | 0.00 | 74.43 | 1.16 | 9.4 | 0.23 | 99.00 | Severe | Moderately severe | Positive |
| 20 | 0.74 | 2.14 | 0.09 | 0.00 | 75.45 | 1.09 | 9.5 | 0.22 | 99.00 | Severe | Severe | Positive |
| 21 | 0.77 | 2.28 | 0.09 | 0.00 | 77.16 | 1.14 | 9.6 | 0.23 | 99.36 | Severe | Severe | Positive |
| 22 | 0.82 | 2.35 | 0.10 | 0.00 | 78.15 | 1.21 | 9.6 | 0.24 | 100.00 | Severe | Severe | Positive |
| 23 | 0.85 | 2.44 | 0.08 | 0.00 | 79.30 | 1.05 | 9.7 | 0.21 | 100.00 | Severe | Severe | Positive |
| 24 | 0.88 | 2.61 | 0.07 | 0.00 | 81.43 | 0.94 | 9.8 | 0.19 | 100.00 | Severe | Severe | Positive |
| 25 | 0.93 | 2.70 | 0.09 | 0.00 | 82.56 | 1.16 | 9.9 | 0.23 | 100.00 | Severe | Severe | Positive |
| 26 | 0.96 | 2.82 | 0.06 | 0.00 | 84.01 | 0.78 | 9.9 | 0.16 | 100.00 | Severe | Severe | Positive |
| 27 | 1.00 | 3.06 | 0.00 | 0.00 | 87.08 | 0.00 | 10.0 | 0.00 | 100.00 | Severe | Severe | Positive |
MINI = Mini-International Neuropsychiatric Interview; PROMIS = Patient-Reported Outcomes Measurement Information System.
DISCUSSION
This is the first study to present the psychometric characteristics of and determine norms for clinical use of the PHQ-9, based on a large nationally representative sample of Brazilian adults. The PHQ-9 presented good psychometric proprieties, represented by good fit to the data, good internal consistency, and significant invariance across sexes, ages, and states. These results allowed us to calculate Brazilian norms that can be widely used by researchers and clinicians to screen for depressive symptoms in clinical practice and primary care institutions.
The PHQ-9 is one of the most important tools for assessing depression, and it can be used for screening and preliminary diagnosis in symptomatic individuals whose care providers have no training in psychopathology. Numerous studies have been conducted on the psychometric properties of the PHQ-9 in other populations.7 Despite some disagreement,25 most studies have found that the PHQ-9 is adequate for depression screening in primary care.26,27 Psychometric studies assessing PHQ-9 measurement invariance have found group invariance across several populations.28,29
Using a representative sample of Brazilians and advanced psychometric analysis, we demonstrated the scale's reliability and furthered the development of norms to guide clinical practice according to the severity of depressive scores, as well as to track depressive symptoms in low-resource settings. The severity assessment can sensitize primary care physicians unfamiliar with psychiatric symptoms and help them provide better and more personalized treatment and follow up.30 In contrast, psychoeducational interventions to improve depression detection among primary care practitioners have improved neither sensitivity nor treatment outcomes in experimental groups,31 which highlights the need for standardized instruments. Compared with traditional well-established cut-offs, such as those of Kroenke et al.,17 PROMIS cut-offs appear more sensitive and less specific for capturing moderate or severe depressive symptoms, as found in a previous study that compared the PHQ-9 with the Mini-International Neuropsychiatric Interview.10 In addition, we used IRT-based methods to determine depression severity. Item analysis ascertained symptom severity, using IRT parameters and IIC as proxy indicators. With IRT, respondents are classified according to their latent depression level, considering that symptoms have different severity levels and correlations with the depression construct and are responsible for variability in PHQ-9 scores. As shown in Table 2, PROMIS classification criteria differed vastly from those of Kroenke et al. For example, the cut-offs for moderate depressive symptoms are = 7 in PROMIS and = 10 in Kroenke's guidelines. This distinction is particularly important because it could indicate a need for clinical attention. Such results must be interpreted according to the care model used in each setting. Although a moderate symptom level indicates the need for clinical attention, it does not indicate an immediate need for specialized treatment. The most appropriate intervention for each symptom level will depend on multiple factors, such as other contextual indicators of clinical attention (e.g., degree of impairment), treatment availability (e.g., psychotherapy, medication), care setting (e.g., primary, specialized), associated risks (e.g., suicide, aggression), etc.
Furthermore, research has shown the importance of including patients in decision-making about their mental health treatment,32 including when to treat depression in primary care.33 To our knowledge, a comparison of different instruments that assess patient understanding of the disease and its impact on the decision-making process has never been performed. However, in our opinion, a visual and logical presentation of symptom severity (rather than the opinion of non-specialists) might help patients, their families, and primary care staff engage in more personalized treatment, and there are several ways to provide it. The most common is the summed score. However, it cannot be compared with other scales, since the meaning of each cut-off point would differ for each scale. Common metrics, such as the percentile rank, and Z and T scores, are needed,14 and the D score could further facilitate this due to its easily understood range (0-10), especially due to Brazilian familiarity with this measure. According to the D score, 0 indicates no symptoms, 0.1-5.9 is near the population average (slight symptoms, which 70% of the population have), 6.0-6.9 indicates mild symptoms (0.5-0.9 SDs above the average; 70th to 80th percentile), 7.0-8.9 indicates moderate symptoms (1-1.9 SDs above the average; 80th to 97th percentile), and = 9.0 indicates severe symptoms (2 or more SDs above the average; the top 3% of scores).
It is important to point out this study's limitations. First, the PHQ-9 is a dimensional scale and, although previously validated to assess depression, we were unable to compare our norms with clinical diagnosis, the gold standard diagnostic criterion. Second, since this is a cross-sectional study, we cannot predict the clinical course of different severity categories. However, we used a large representative sample of Brazilian adults, and the method allowed us to achieve the study's objectives.
In sum, this is the first study to characterize norms for the PHQ-9 in Brazilian populations using rigorous statistical methods. Due to a lack of evidence regarding general screening for depression in primary care,34-37 the PHQ-9 should only be administered to individuals with suspected clinical depression. While subject to new empirical investigation, this tool could be used to test specific interventions for each severity group. Individuals with no or slight symptoms could be reassured that it is unlikely they are experiencing a major clinical problem. Those with mild symptoms should be encouraged to engage in psychoeducation about their symptoms, exercise, develop better sleeping and eating habits, and spend more time doing pleasurable activities, such as spending time with friends and family. In addition to the strategies above, further assessment could help stratify the primary care level in individuals with moderate symptoms. Those with severe symptoms could be encouraged to visit a mental health professional. These scores could also be used to track treatment response and continuous care outcomes.
ACKNOWLEDGEMENTS
MSH is supported by the U.S. National Institutes of Mental Health (grant number R01MH120482) in his post-doctoral fellowship at the Universidade Federal do Rio Grande do Sul. RFD received a grant from Fundação do Amparo à Pesquisa do Estado de São Paulo (FAPESP), process number #2021/14379-8.
 PDF
 Print
 Send this article by email
 How to cite this article
 Submit a comment
 Mendeley
 Pocket
 Share on Facebook
 Share on Twitter