


ABSTRACT:
OBJECTIVE: Transcranial direct current stimulation (tDCS) has mixed effects for major depressive
disorder (MDD) symptoms, partially owing to large inter-experimental variability in
tDCS protocols and their correlated induced electric fields (E-fields). We investigated
whether the E-field strength of distinct tDCS parameters was associated with antidepressant
effect.
METHODS: A meta-analysis was performed with placebo-controlled clinical trials of tDCS enrolling
MDD patients. PubMed, EMBASE, and Web of Science were searched from inception to March
10, 2023. Effect sizes of tDCS protocols were correlated with E-field simulations
(SimNIBS) of brain regions of interest (bilateral dorsolateral prefrontal cortex [DLPFC]
and bilateral subgenual anterior cingulate cortex [sgACC]). Moderators of tDCS responses
were also investigated.
RESULTS: A total of 20 studies were included (21 datasets, 1,008 patients), using 11 distinct
tDCS protocols. Results revealed a moderate effect for MDD (g = 0.41, 95%CI 0.18-0.64),
while cathode position and treatment strategy were found to be moderators of response.
A negative association between effect size and tDCS-induced E-field magnitude was
seen, with stronger E-fields in the right frontal and medial parts of the DLPFC (targeted
by the cathode) leading to smaller effects. No association was found for the left
DLPFC and the bilateral sgACC. An optimized tDCS protocol is proposed.
CONCLUSIONS: Our results highlight the need for a standardized tDCS protocol in MDD clinical trials.
REGISTRATION NUMBER: PROSPERO CRD42022296246.
Keywords: Transcranial direct current stimulation; depression; computational modeling analysis; electric field; meta-analysis; major depressive disorder; dorsolateral prefrontal cortex; subgenual anterior cingulate cortex.
FIGURES
| Received: March 13 2023; Accepted: June 8 2023 |
INTRODUCTION
Major depressive disorder (MDD) is one of the most prevalent mental conditions, affecting about 3% of the population worldwide.1 Current first-line treatments such as antidepressant drugs and psychotherapy are only moderately effective, besides presenting several adverse effects and being time-consuming, respectively.2,3 In such a scenario, transcranial direct current stimulation (tDCS), a noninvasive brain stimulation (NIBS) intervention, has arisen as an alternative for MDD treatment. tDCS is promising as it presents potential advantages as compared to other NIBS techniques, including an excellent safety and tolerability profile, low cost, ease of use, and the potential to be applied at home.4,5
In tDCS, a weak direct current is applied through electrodes placed on the scalp to modulate brain activity towards an increase or decrease in endogenous neuronal firing; it is able to shift membrane potential towards hyperpolarization or depolarization.4,6 In patients with MDD, tDCS is mainly applied over the dorsolateral prefrontal cortex (DLPFC), a brain region that exhibits unbalanced activity between the left and right hemispheres in MDD.7,8 The rationale behind antidepressant effects of tDCS is that the current can restore the balance between left and right DLPFC activity.9 Moreover, by stimulating the DLPFC, deeper brain areas implicated in depression, such as the subgenual anterior cingulate cortex (sgACC), can be indirectly modulated via structural and functional connections with the DLPFC.10-12 In tDCS protocols for MDD, the anode is usually placed over the left DLPFC, which presents decreased activation, whereas the cathode position varies considerably among clinical trials, including the right DLPFC, frontoparietal area, right supraorbital region, or deltoid muscle.7,8 The application of prefrontal tDCS has been primarily investigated in randomized clinical trials, which have shown promising antidepressant effects.13 Nonetheless, discrepant findings have been reported,14,15 leading to an overall modest tDCS antidepressant effect.16
One possible explanation for the mixed effects of tDCS for MDD is inter-experimental variability, which includes tDCS parameters such as electrode size and arrangement, current intensity, targeted area, and the conductive agent.17 Indeed, wide variability in tDCS parameters is seen in clinical trials of MDD. Crucially, with a high variability in tDCS parameters across trials, the electric field (E-field) induced in the brain can vary significantly. Studies investigating simulated tDCS-induced E-fields in the prefrontal cortex have shown that heterogeneity in tDCS parameters can substantially change the mean strength of E-fields in brain regions of interest.18 E-field magnitude in specific parts of the brain can also influence the overall tDCS response in depressive patients.19 Surprisingly, to the best of our knowledge, no study has systematically investigated the impact of distinct tDCS parameters on the clinical efficacy of tDCS for depressive symptoms.
Given these initial findings, we hypothesized that tDCS-induced E-field strength differences caused by distinct tDCS parameters could be associated with the mixed effects of tDCS for depression. Therefore, we used a meta-analytic approach to investigate the association between simulated E-field strength in brain regions of interest and effect sizes of continuous depression severity outcomes of different tDCS protocols. Firstly, we performed a pairwise meta-analysis of placebo-controlled clinical trials of tDCS for MDD and explored methodological tDCS predictors of response via subgroup and meta-regression analyses. Secondly, we correlated the effect size of the included studies with E-field magnitude in brain regions of interest: the bilateral DLPFC and the bilateral sgACC. These regions were selected because they are functionally and anatomically related to MDD symptoms.12,19,20 Finally, in the case of a significant association between E-field magnitude and effect size in the brain regions of interest, we modeled an optimized tDCS montage based on our findings.
This study is essential for the tDCS field as it can provide further knowledge on how inter-experimental differences in tDCS parameters can impact the overall therapeutic effect in MDD trials, and may yield important insights for future clinical trials.
METHODS
Systematic review
A systematic review was performed in three different databases (EMBASE, MEDLINE/PubMed, and Web of Science) from the first date available until September 30, 2022. An updated search was carried out on March 10, 2023. The search strings included terms for "tDCS," "depression," and "clinical trials" with no language restriction (provided in their entirety in the Supplementary Material S1, available online only). For additional references, experts in the field were contacted. The first and fourth authors independently searched the literature and screened the titles and abstracts for eligible articles. In case of disagreement, the last author decided. This study was registered on the international prospective register of systematic reviews (PROSPERO) with accession number CRD42022296246, and the present report adheres to the Preferred Reporting Items for Systematic reviews and Meta-Analyses (PRISMA) statement.21
Eligibility criteria
Only randomized, sham-controlled trials enrolling adult patients with an acute depressive episode associated with a diagnosis of MDD were included. Regarding interventions and comparisons, trials should have included groups receiving active vs. sham tDCS, with at least five treatment sessions. Studies applying tDCS in conjunction with other therapies (e.g., medication and behavioral interventions) were also included. Finally, continuous outcomes should be reported.
Risk of bias
The methodological quality of the included studies was assessed with the Cochrane risk-of-bias tool (RoB 2), as recommended by the Cochrane Group.22 One author (LBR) independently assessed the risk of bias in each study, which was double-checked by another author (SDS). The domains assessed in the RoB 2 tool were selection bias, performance bias, attrition bias, detection bias, and reporting bias, according to a standardized criterion, and studies were categorized as low risk, high risk, and some concerns.
Data extraction
Data extraction was performed by one author (LBR) and double-checked by the last author (MAV). The variables extracted were: 1) clinical and demographic data: age and gender; 2) depression characteristics, including treatment-resistant depression, and depression scales; 3) tDCS treatment features: number of sessions, session duration, current intensity, electrodes position, current density, electrode size, and use of concomitant therapies; 4) information on outcomes: mean and SD scores of depression rating scales at baseline and endpoint in both active and sham groups; 5) metadata: year of publication, authorship, and methodological variables for quality assessment.
If studies did not report any essential information, such as mean score, SD, and sample size, the corresponding author was contacted by e-mail. When no reply was obtained, clinical data (mean and SD) were extracted from the article's graphs with the aid of WebPlotDigitizer,23 as recommended elsewhere.24
Outcome
Continuous outcomes (depression score at baseline and endpoint) of the active and sham groups were analyzed. Response and remission rates were not used in this meta-analysis as they do not allow for a more fine-grained exploration of predictor variables associated with E-field modeling analysis. Moreover, as some randomized controlled trials reported depression scores at more than one time point, only data from the longest period prior to unblinding (i.e., the endpoint) were used. Meta-regression analyses were conducted based on methodological variables, including cathode position, treatment strategy (subgrouped into three categories: monotherapy, augmentation, and add-on strategy), electric current intensity/density, and electrode size. The mean age (above and below mean) was also meta-regressed to account for possible age-related structural decline. Afterwards, an association between clinical improvement and E-field modeling analysis was investigated.
E-field modeling analysis
E-field modeling was performed using E-field simulations done in SimNIBS version 3.2,25 a software package that allows simulation of tDCS-induced E-fields in the individual brain and an approximation of the actual current distribution in the brain. First, based on a T1-weighted magnetic resonance imaging (MRI) anatomical image, high-resolution head models were created using the headreco pipeline in SimNIBS.26 This pipeline is dependent on MATLAB software (version R2022 was used) and was chosen since it is the most recent tool with a segmentation that includes the neck for placement of extracephalic electrodes. The pipeline segments five tissue types based on the provided structural MRI scan: white matter, gray matter, cerebrospinal fluid (CSF), bone, and scalp. Then, it creates a 3D tetrahedral mesh structure of each segmented tissue, which allows for simulation of the E-field. Standard SimNIBS conductivity values for each tissue type (sskin = 0.465 S/m, sbone = 0.01 S/m, scsf = 1.654 S/m, sgm = 0.275 S/m, swm = 0.126 S/m) were used.27 Then, manual verification was performed to check the quality of segmentation for possible errors in the established boundaries between tissues.
Three-dimensional tetrahedral tDCS montages, intensities, and electrode materials, as described in each study, were used for simulations. First, we performed the analysis using only one brain of a 39-year-old male depressive patient. Afterwards, we used head-models of three depressive patients (two males and one female, aged 39, 41, and 36 years, respectively), to account for individual variability17 and to investigate whether the results were maintained. This methodology was used as it can reduce interindividual variability in brain anatomy.17 All images were acquired in a 3-T MR system (Achieva, Philips Healthcare, Netherlands). Volumetric images were based on T1-weighted sequences using a 3D FFE pulse sequence with the following parameters: FOV 240 × 240 × 180 mm3, spatial resolution 1 × 1 × 1 mm3, TR 7 ms, TE 3.2 ms, FA 8°, and 180 sagittal slices.
The 3D segmented head models were then used to simulate the E-field distribution resulting from the various tDCS montages used in each study protocol included in this analysis. This was done by placing simulated electrodes on each head model and setting the simulated electric current intensity according to the stimulation protocol. In studies in which the direction of the rectangular electrodes was not specified (e.g., towards Cz or not), the corresponding authors were contacted by e-mail.
The values analyzed in this study were the E-norm component, which represents the vector strength, but not its direction.
E-field values
E-field values were extracted from anatomical brain regions shown to be structurally and functionally implicated in MDD symptoms. Specifically, the regions of interest were the bilateral DLPFC and the bilateral sgACC. For identification of the DLPFC, we used the Sallet et al.28 atlas, which provides a parcellation of the DLPFC and was previously used in several studies of our team. This atlas divides the DLPFC into 7 DLPFC clusters, but here these regions were collapsed into three subregions, corresponding to: 1) a more frontal part of the DLPFC (cluster 3, cluster 4, and cluster 7); 2) a medial part of the DLPFC (cluster 5, cluster 6, and cluster 10); and 3) a posterior part of the DLPFC (cluster 8) (see Supplementary Material S2). For sgACC identification, the Brainnetome atlas was used bilaterally.29 This atlas is a whole-brain, multimodal parcellation atlas based on structural MRI, diffusion tensor imaging, and resting-state fMRI connectivity.
To account for interindividual variability in our analysis with three head models, the mean E-field of each region of interest was used.
Statistical analyses
All analyses were performed in R software (Rstudio version 4.2.2) using the metafor package.30 For the pairwise meta-analysis, sample size, SD, and mean scores from the endpoint of both active and sham groups were used to generate the effect size. A random effects model, instead of a fixed effects model, was used, considering that heterogeneity among studies would be high. Hedges' g was the effect size measure. Heterogeneity was considered high when I2 > 50%. To investigate the small studies' effects, a funnel plot was constructed and the Egger test was applied. Based on previous findings,8 we conducted subgroup analyses with three variables (cathode position, treatment strategy, and mean age) and univariate meta-regressions with other methodological variables of tDCS (electric current density/intensity and electrode size), using the metareg command.
We also used the metareg function to correlate effect sizes of each study with the E-field values of tDCS protocols of each brain region of interest. Overall, four models were constructed for both hemispheres (DLPFC subregions A, B, C, and sgACC region). Positive and negative values reflect a positive or negative association between effect size and E-field strength per tDCS protocol, respectively. P-values = 0.05 were considered significant.
tDCS protocol optimization
We used the SimNIBS optimization routine, introduced in version 3.2.31 The optimization algorithm was performed using the three head models and 74 potential electrode positions according to the 10-10 EEG system. Based on the results, the position of interest was set to be F3 with a radius of 10 mm surrounding it. Furthermore, the optimization was set to avoid location F8 (based on the E-field analysis and metaregression results) and a radius of 10 mm (standard value) surrounding it. No other restraints were set in the E-field direction. We ran an optimized multi-electrode montage with up to 8 circular (3.14 cm2) electrodes (standard optimization procedure provided by SimNIBS), with the maximum intensity set to 1 mA per electrode and 2 mA total current.
RESULTS
Overview
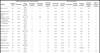
The literature search yielded 946 articles, of which 926 were excluded for various reasons (Figure S1, available as online-only supplementary material). Overall, 20 studies (21 datasets) using tDCS for the treatment of MDD were included in this pairwise meta-analysis with a total of 1,008 patients, of whom 549 received active tDCS and 457 received sham tDCS.13-15,32-48 Overall, 58% of the included participants were women, with a mean age of 43.9 years (Table 1). Among the included studies, 11 different tDCS protocols were applied, varying in terms of electrode position, current intensity, and electrode sizes. Cochrane risk-of-bias assessment revealed that 60, 10, and 30% of the included studies presented low risk, some concerns, and high risk of biases, respectively (Table S1, available as online-only supplementary material).
| Clinical and depression characteristics | thCS parameters | ||||||||||||
|---|---|---|---|---|---|---|---|---|---|---|---|---|---|
| Author | Sample size | Women(%) | Mean age(SD) | Treatment strategy | Treatment-resistant | Current intensity (mA) | Electrode size (cm2) | Current density | Sessions(n) | Anode position | Cathode position | Session duration (min) | tDCS protocol group |
| Aust et al.32 | 95 | 53.0 | 40.9 (13.8) | 2 | 0 | 2.0 | 35.0 | 0.57 | 12 | F3 | F4 | 30 | 1 |
| Bennabi et al.33 | 48 | 64.4 | 60.2 (13.7) | 2 | 1 | 2.0 | 35.0 | 0.57 | 10 | F3 | Fp2 | 30 | 2 |
| Blumberger et al.34 | 25 | 83.3 | 47.5 (10.5) | 1 | 1 | 2.0 | 35.0 | 0.57 | 15 | F3 | F4 | 20 | 1 |
| Boggio et al.35 | 32 | 64.5 | 49.1 (7.4) | 0 | NR | 2.0 | 35.0 | 0.57 | 10 | F3 | Fp2 | 20 | 2 |
| Brunoni et al.36 ( - Sertraline) | 60 | 68.5 | 43.7 (13.0) | 0 | 1 | 2.0 | 25.0 | 0.80 | 12 | F3 | F4 | 30 | 3 |
| Brunoni et al.36 (+ Sertraline) | 60 | 68.0 | 41.0 (12.5) | 2 | 1 | 2.0 | 25.0 | 0.80 | 12 | F3 | F4 | 30 | 3 |
| Brunoni et al.37 | 37 | 29.0 | 43.8 (10.5) | 2 | 1 | 2.0 | 25.0 | 0.80 | 10 | F3 | F4 | 30 | 3 |
| Brunoni et al.14 | 154 | 68.0 | 42.8 (12.3) | 0 | 1 | 2.0 | 25.0 | 0.80 | 22 | F5 | F6 | 30 | 4 |
| Fregni et al.13 | 19 | 61.0 | 46.6 (9.8) | 0 | NR | 1.0 | 35.0 | 0.28 | 5 | F3 | Fp2 | 20 | 5 |
| Loo et al.38 | 40 | 55.0 | 47.3 (11.2) | 1 | 0 | 1.0 | 35.0 | 0.29 | 5 | Fp3 | F8 | 20 | 6 |
| Loo et al.39 | 64 | 47.0 | 48.2 (12.5) | 1 | 1 | 2.0 | 35.0 | 0.57 | 15 | Fp3 | F8 | 20 | 7 |
| Loo et al.15 (Unipolar) | 84 | 50.0 | 48.1 (14.9) | 1 | 1 | 2.5 | 35.0 | 0.71 | 20 | F3 | F8 | 30 | 8 |
| Mayur et al.40 | 16 | 37.5 | 45.0 (14.6) | 2 | 1 | 2.0 | 25.0 | 0.80 | 10 | F3 | F4 | 30 | 3 |
| Moirand et al.41 | 40 | 61.5 | 49.8 (9.5) | 1 | 1 | 2.0 | 35.0 | 0.57 | 10 | F3 | F4 | 30 | 1 |
| Nord et al.48 | 39 | 51.3 | 33.3 (10.5) | 2 | 1 | 1.0 | 35.0 | 0.28 | 8 | F3 | Deltoid | 20 | 9 |
| Pavlova et al.42 | 69 | 72.0 | 38.3 (11.0) | 2 | 0 | 0.5 | 26.2 | 0.29 | 10 | F3 | Fp2 | 25 | 10 |
| Salehinejad et al.43 | 30 | 56.6 | 28.3 (N/I) | 0 | NR | 2.0 | 35.0 | 0.57 | 10 | F3 | F4 | 20 | 1 |
| Salehinejad et al.44 | 24 | 62.5 | 26.2 (5.8) | 0 | NR | 2.0 | 35.0 | 0.57 | 10 | F3 | F4 | 20 | 1 |
| Segrave et al.45 | 27 | 37.0 | 41.6 (12.9) | 2 | NR | 2.0 | 35.0 | 0.57 | 5 | F3 | F8 | 24 | 1 |
| Sharafi et al.46 | 30 | 53.0 | 47.3 (11.6) | 0 | 1 | 2.0 | 20.0 | 1.00 | 10 | F3 | F4 | 20 | 11 |
| Welch et al.47 | 14 | 85.7 | 54.8 (10.2) | 2 | 1 | 2.0 | 25.0 | 0.80 | 12 | F3 | F4 | 30 | 3 |
mA = milliampere; min = minutes; NR = not reported; tDCS = transcranial direct current stimulation.
Pairwise meta-analysis and meta-regression
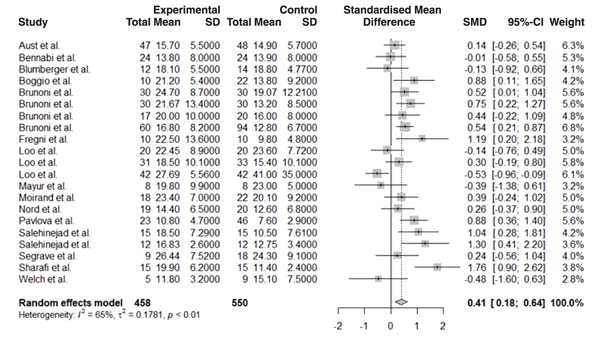
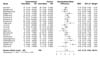
The effect sizes of endpoint depression scores for each study were calculated. Meta-analysis results showed that active tDCS was superior to sham (n=21, Hedges's g = 0.41, 95%CI 0.18-0.64) (Figure 1), with a moderate effect size. High heterogeneity was observed among studies (I2 = 65%). The funnel plot showed a relatively symmetrical distribution (Figure S2, available as online-only supplementary material), revealing no substantial evidence of publication bias, and the Egger test corroborated this finding (t = 0.83, p = 0.41).
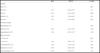
Subgroup analyses revealed that cathode placement over F4 was more effective than cathode over F8 (p = 0.047), but was not different to deltoid, FP2, or F5 positions (ps > 0.78) (a forest plot with effect size per tDCS montage can be seen in Figure S3). Regarding treatment strategy, tDCS applied as monotherapy was superior to add-on (p < 0.01) and augmentative (p < 0.01) strategies. No other methodological variable was associated with antidepressant effects (Table 2).
| Beta | 95%CI | p-value | |
|---|---|---|---|
| Cathode | |||
| F4 (n=11) | - | - | Ref. |
| Fp2 (n=4) | 0.17 | -0.45 to 0.79 | 0.6 |
| F8 (n=4) | -0.56 | -1.14 to -0.01 | 0.047 |
| Deltoid (n=1) | -0.23 | -1.30 to 0.82 | 0.82 |
| F6 (n=01) | -0.23 | -1.30 to 0.82 | 0.66 |
| Treatment strategy | |||
| Monotherapy (n=7) | - | - | Ref. |
| Add-on┼ (n=5) | -0.94 | -1.43 to -0.45 | < 0.01 |
| Augmentation╬ (n=9) | -0.61 | -1.05 to -0.17 | < 0.01 |
| Mean age (years) | |||
| < 43.9 (n=18) | - | - | Ref. |
| > 43.9 (n=3) | 0.42 | -0.26 to 1.10 | 0.23 |
| Current density (n=21) | 0.15 | -1.10 to 1.40 | 0.20 |
| Electrode size (n=21) | -0.01 | -0.06 to 0.02 | 0.46 |
| Current intensity (n=21) | -0.03 | -0.70 to 0.12 | 0.16 |
Relation between E-field strength and antidepressant effects
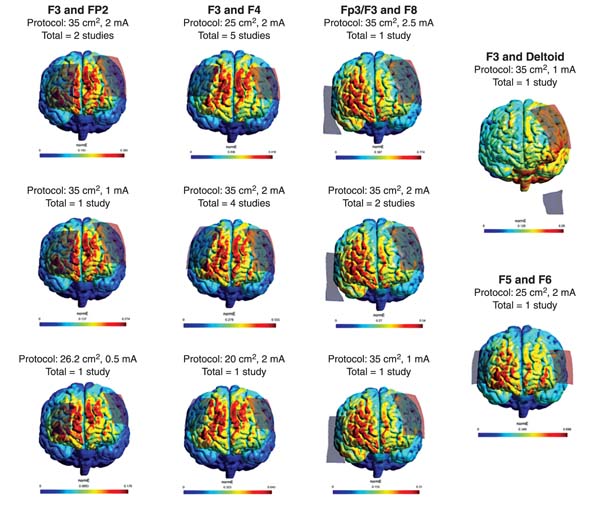
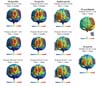
The included studies used 11 different tDCS protocols, accounting for electrode size, current intensity, and electrode montage, which induced substantial differences of E-field strength in different portions of the brain (Figure 2). Therefore, a correlation between E-field magnitude of brain regions of interest and effect size per study was conducted.
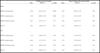
We first correlated the effect size with mean E-field strength in regions of interest of only one brain. For the right hemisphere of the DLPFC, where only the cathode was applied, results showed a negative association between antidepressant effect for the frontal DLPFC portion (subregion A: ß = -3.20, p = 0.049, 95%CI -6.45 to -0.01) and medial DLPFC portion (subregion B: ß = -3.46, p = 0.02, 95%CI -7.40 to -0.71), but not for the most posterior part of the DLPFC (subregion C: ß = -2.87, p = 0.31, 95%CI -8.50 to 2.77). In turn, no association was found for the left DLPFC, where only the anode was applied (subregion A: ß = -1.43, p = 0.50, 95%CI -5.60 to 2.70; subregion B: ß = -0.98, p = 0.70, 95%CI -5.70 to 3.70; subregion C: ß = -2.30, p = 0.50, 95%CI -9.00 to 4.40). Finally, neither sgACC presented any significant association with the outcome (right: ß = 2.02, p = 0.31, 95%CI -1.90 to 5.95; left: ß = -4.51, p = 0.14, 95%CI -10.55 to 1.50). Interestingly, similar results were found when the effect sizes were correlated with the mean E-field of three head models (Table 3; Figure S4).
| E-field of one head model | Mean E-field of three head models | |||||
|---|---|---|---|---|---|---|
| Beta | 95%CI | p-value | Beta | 95%CI | p-value | |
| Right | ||||||
| DLPFC frontal portion | -3.20 | -6.45 to -0.01 | 0.049 | -3.50 | -6.30 to -0.70 | 0.02 |
| DLPFC medial portion | -3.46 | -6.86 to -0.06 | 0.046 | -4.21 | -7.48 to -0.94 | 0.01 |
| DLPFC posterior portion | -2.87 | -8.53 to 2.77 | 0.31 | -3.84 | -8.28 to 0.55 | 0.09 |
| SgACC | 2.02 | -1.90 to 5.95 | 0.31 | -4.10 | -9.60 to 1.45 | 0.14 |
| Left | ||||||
| DLPFC frontal portion | -1.43 | -5.60 to 2.70 | 0.50 | -3.40 | -7.30 to 0.43 | 0.08 |
| DLPFC medial portion | -0.98 | -5.7 to 3.70 | 0.70 | -3.70 | -7.80 to 0.43 | 0.08 |
| DLPFC posterior portion | -2.30 | -9.00 to 4.40 | 0.50 | -3.90 | -8.40 to 0.70 | 0.10 |
| SgACC | -4.51 | -10.60 to 1.55 | 0.14 | -4.50 | -10.50 to 1.53 | 0.14 |
Bold type denotes statistical significance.
DLPFC = dorsolateral prefrontal cortex; E-field = electric field; SgACC = subgenual anterior cingulate cortex.
Optimized tDCS protocol
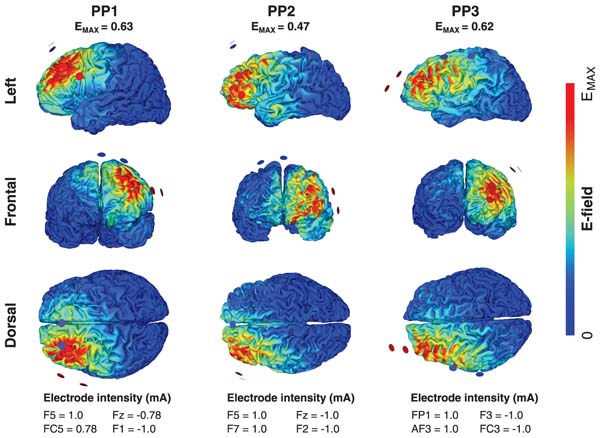
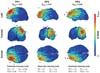
We based our tDCS optimization on the observation that E-fields analysis showed lower antidepressant effect with stronger E-fields in the frontal and medium parts of the DLPFC and in the bilateral sgACC. The optimization was also based on our metaregression findings revealing that cathodal positions over F8 (right DLPFC) were less effective against depression symptoms compared to F4. Thus, we targeted F3 (left DLPFC) - the standard target for the anode position - to have the maximum E-field, and avoided F8 (for details, see Methods), with an electric current no greater than 2 mA. Results showed optimal protocols using distinct electrode montages from head to head, by applying multielectrode setups (two anodes and two cathodes, all 3.14-cm2 circular electrodes; see electrode position in Figure 3) with intensities up to 2 mA (+1 mA for each anode and -1 mA for both cathodes) and having the peak current in the left DLPFC. These montages lead to a maximum E-field value of 0.62 mV/mm, 0.63 mV/mm, and 0.47 mV/mm at the left DLPFC.
DISCUSSION
In this study, we systematically evaluated the antidepressant effects of tDCS and their association with induced E-fields of different tDCS protocols using a computational modeling analysis. Data from 20 placebo-controlled clinical trials (21 datasets; 1,008 patients) were synthesized and showed a moderate antidepressant effect of active tDCS in comparison to placebo (Hedges' g = 0.41). The risk of bias was mostly low or unclear (70%), with no evidence of publication bias. Nine different tDCS protocols and four tDCS electrode montages were used in the included studies, varying in terms of electrode position, current intensity, and electrode sizes, which impacted the E-field distribution of each included study. A negative association between the effect size of distinct tDCS protocols and E-field strength in specific brain regions was seen, showing that stronger E-fields in the frontal and medial part of the DLPFC lead to a smaller tDCS effect on depression, whereas no association was found for the left DLPFC or either sgACC. The same results were replicated in one head model, for the mean E-fields of three head models. The results are discussed in detail below.
Pairwise meta-analysis
Based on our previous publication,8,49,50 here we performed an updated pairwise meta-analysis including a large, recently published tDCS trial32; findings still show a modest antidepressant effect of tDCS, with mixed effects across trials. Overall, a mixed effect of prefrontal tDCS has been seen in several fields of investigation.49,50 For instance, a recent meta-analysis showed only a small effect of tDCS probing the PFC to increase working memory performance in healthy participants,17 an umbrella review found null and/or small effects of prefrontal tDCS for a range of cognitive domains,51 and the most updated meta-analysis in depression showed only a moderate effect size favoring active tDCS.16 The mixed effects of tDCS targeting the PFC have been the topic of discussion in recent work in the field,52,53 which suggests that inter-experimental and inter-individual variability might play an important role in this heterogeneity. As such, here we investigated some methodological predictors of tDCS response.
It has been extensively discussed that tDCS effects might be modulated when it is combined with other interventions.54 As tDCS is a state-dependent intervention, i.e., its effects are dependent on the neural activity in the targeted area and adjacent network, controlling ongoing neural activation by combining tDCS with other interventions might improve the desired outcome and reduce individual variability effects.52,55 This explanation corroborates some findings in the depression field, such as those reported by Segrave et al.45 and Vanderhasselt et al.,56 in which the concurrent application of tDCS and cognitive control training enhanced antidepressant outcomes compared to either tDCS or cognitive training as monotherapy.
However, although research into the effects of combined protocols is increasing, a metaregression analysis performed in our review revealed that studies using treatment strategies including add-on and augmentative therapy presented significantly lower effects on the reduction of depression scores when compared to tDCS as monotherapy. These results are similar to the findings of a recent meta-analysis by our group.8 This could be explained by several factors, including: 1) a lack of consensus regarding the optimal interventions (i.e., oral antidepressants or psychological interventions) to combine with tDCS treatment - and, accordingly, a lack of systematic analyses investigating how the combination of different interventions might interact (i.e., positive, neutral, or negative); 2) for psychological interventions, such as cognitive behavioral therapy or cognitive training, there is not enough knowledge on whether these methods should be applied before, during or after tDCS, leading to high inter-experimental variability.32,57 Moreover, it is speculated that psychological interventions such as cognitive-behavioral therapy might activate a diffuse neural network compared to tDCS.32 Therefore, although the literature suggests that the combination of tDCS with other interventions might be beneficial for the treatment of mood disorders, this should be carefully discussed and systematically evaluated in future studies.
Our metaregression results also revealed cathode position as a possible moderator of tDCS response, with more lateralized electrodes - placed over F8 - being associated with lower antidepressant response in comparison to those placed over Fp2, F4, deltoid, or F5. In a previous meta-analysis by our group, a trend for lower antidepressant response was also found for F8 cathode placement.8
tDCS-induced E-field and antidepressant effect
Crucially, our findings demonstrate that E-field magnitude in the frontal and medial parts of the right DLPFC negatively affects the antidepressant effects of tDCS, whereas no association was found for the left DLPFC and the bilateral sgACC. To the best of our knowledge, this is the first study to systematically quantify tDCS-induced E-fields in randomized clinical trials of tDCS in MDD. Interestingly, given that prior research has demonstrated unbalanced activity in the left and right DLPFC in patients with MDD, tDCS electrodes in clinical trials have been systematically applied over the bilateral DLPFC. However, although it appears there is a consensus about placing the anode over the left DLPFC of depressive patients, the cathode location varies across clinical trials. In this sense, a recent guideline considered tDCS as definitively effective for depression when using the anode over the left DLPFC, but no recommendation was made for the cathode location - nor for current intensity and electrode size.58
Importantly, the negative association between E-field and antidepressant response in the right DLPFC might to some extent explain the lack of recommendation regarding cathode position for the treatment of depression in the most recent guideline on this topic.58 Analogously, the E-field modeling findings of our study reinforce that the inter-experiment heterogeneity in tDCS protocols, especially over the right DLPFC, might explain the variability in tDCS antidepressant response. Figure 2 shows how heterogeneous tDCS-induced E-fields are in the right DLPFC across tDCS studies for MDD. In turn, the left DLPFC displays less inter-experimental variability of E-fields (all included studies have anode placed over the left DLPFC). This is presumably related to increasing evidence that the left DLPFC plays a direct role in depression symptoms, and may have both limited exploration of the parameter space for the anode position and restricted E-field values in this region.59-61
Therefore, consolidating all results of our analyses, we investigated an optimized tDCS protocol for depression having the left DLPFC as our main target and avoiding F8 placement (i.e., lateral right PFC, based on our metaregression findings). An optimized protocol holds the possibility of reducing inter-experimental variability while increasing the tDCS antidepressant response, and particularly reducing variability when individualized tDCS doses are not available.62 Interestingly, the optimization protocol resulted in different electrode positions across the three head models, but all montages induced a maximized E-field in the left DLPFC and excluded the right hemisphere almost completely. It is expected that electrode position would vary from person to person in order to account for interindividual variability, which might be caused by individual brain volume, cortical thickness, or even scalp-brain distance due to age-related atrophy, for instance.63,64 In this sense, it is optimal that individual models be simulated prior to the tDCS session to ascertain optimal electrode placement for each patient, with special attention to older adults, who might exhibit higher heterogeneity in brain structures.65 Nonetheless, the optimized montages proposed herein suggest that unilateral stimulation may be more beneficial compared to bilateral stimulation to target the DLPFC. This is in agreement with the observation that peak E-fields are typically observed between, rather than directly under, the tDCS electrodes.66,67
Since almost all reviewed studies used bilateral montages (anode over the left DLPFC and cathode over the right PFC), assessing the effect of montages focusing on the left DLPFC alone would be an interesting avenue in the future. Interestingly, for transcranial magnetic stimulation (TMS), typically only the left DLPFC is targeted (computational modeling analysis confirms a more focused current for this intervention),68 and it seems that the same may hold for tDCS. Furthermore, our findings align with a recent tDCS computational modeling analysis investigating working memory performance in healthy participants, in which the researchers showed that targeting only the left PFC might increase performance.17 In such a scenario, another possible way to increase E-field strength in the targeted location (left DLPFC) using tDCS would be use of a high-definition methodology (HD-tDCS), which is known to increase current focality,69 in MDD.70
Finally, another important use case for computational modeling analysis in the tDCS field is dose individualization, which can reduce inter-individual variability and increase treatment response.71,72 In this sense, our findings also suggest that inter-experimental variability in tDCS electrode location plays an important role in the measured antidepressant effect, which might be considered in future studies.
This study has several limitations that should be underscored. First, inter-individual variability was not investigated in this analysis. Factors including individual cortical thickness, skull thickness, head shape, brain size, and gyrification can directly impact E-field strength in cortical regions, and we highly encourage their investigation in future studies aiming to evaluate whether individual anatomy can impact tDCS antidepressant effects. Although three head models of depressive patients were used to account for anatomical brain differences, there is still not enough information on how many head models are ideal to account for variability in simulated E-field analysis. Second, a total of 11 tDCS protocols were applied across the 21 trials included in this meta-analysis. Seven tDCS protocols were used in a single trial, which might have caused bias towards a single-study effect. Third, the current direction was not assessed. However, as the cathode was always placed over the right DLPFC and the anode over the left DLPFC, current direction remained constant for all montages. Fourth, as a limitation of the statistical methodology adopted, aggregate meta-analysis has a poorer performance than individual patient data meta-analysis, especially for identifying moderators of the outcome of interest. However, an individual patient data design would have required neuroimaging acquisition in all participants included in the clinical trials, which is unfeasible, since only a few trials collected anatomical neuroimaging at baseline.
In this study, we systematically investigated the association between the effect size of distinct tDCS protocols used in randomized clinical trials for MDD and tDCS-induced E-field strength in specific brain regions. To perform these analyses, we first conducted a pairwise meta-analysis and correlated its findings with a computational modeling analysis of the different tDCS parameters. Overall, there were 20 studies (21 datasets, 1,008 participants) and 11 different tDCS protocols. The results showed a moderate antidepressant effect of tDCS for MDD, and metaregression analysis showed that cathode position and treatment strategy might be possible predictors of tDCS response. Analysis of correlation between effect sizes and the computational modeling results showed that stronger E-fields in the frontal and medial parts of the right DLPFC targeted by the cathode were associated with less improvement of depression, whereas no associations were found for the left DLPFC. Importantly, this study showed, for the first time, that differences in simulated E-fields - based on distinct tDCS parameters - can be implicated in the heterogeneity of effects reported across clinical tDCS trials in patients with MDD. Therefore, we propose an optimized tDCS protocol to guide future studies. Our results highlight the need for a standardized tDCS protocol in MDD clinical trials, possibly targeting the left DLPFC specifically, to increase antidepressant effects.
ACKNOWLEDGEMENTS
LBR is currently supported by a Research Foundation Flanders grant (Fonds voor Wetenschappelijk Onderzoek [FWO]; grant G0F4619N). SDS is funded by a FWO-Flanders PhD fellowship (grant 11J7521N). PHRS is supported by FAPESP (grant 22/03266-0). BC is supported by an SRP57 grant from the Vrije Universiteit Brussel. ARB receives grants from Conselho Nacional de Desenvolvimento Científico e Tecnológico (CNPq; PQ-1B) and Fundação de Amparo à Pesquisa do Estado de São Paulo (FAPESP; grants 2018/10861-7, 2019/06009-6). MAV receives funding from the FWO and from Ghent University (grants G0F4619N and BOF17/STA/030, respectively). The LIM-27 laboratory (Laboratório de Neurociências, Instituto de Psiquiatria, Hospital das Clínicas, Faculdade de Medicina, Universidade de São Paulo, São Paulo, Brazil) receives grants from Associação Beneficente Alzira Denise Hertzog da Silva.
We thank our master's program student Xander Cornelis for organizing the data for this study.
DISCLOSURE
ARB has a small equity stake in Flow™, whose devices were not used in the present study. The other authors report no conflicts of interest.
 PDF
 Print
 Send this article by email
 How to cite this article
 Submit a comment
 Mendeley
 Pocket
 Share on Facebook
 Share on Twitter