


ABSTRACT:
OBJECTIVE: Vascular cognitive impairment (VCI) is a major cause of cognitive decline associated
with vascular brain injury. Behavioral and psychological symptoms of dementia (BPSD)
are common, but their prevalence across VCI subtypes remains unclear. This study examines
the prevalence of BPSD in different VCI subtypes.
METHODS: A systematic review and meta-analysis were conducted following PRISMA guidelines.
Studies assessing BPSD in patients with VCI were retrieved from PubMed, Embase, and
Web of Science. Studies were eligible if they used the Neuropsychiatric Inventory
(NPI) to evaluate symptoms. Pooled prevalence rates for each NPI domain were calculated
using a random-effects model.
RESULTS: Thirty-five studies (n=5,805) were included. In unspecified VCI, apathy (54.29%),
depression (43.48%), and irritability (38.76%) were most common. Subcortical VCI was
associated with higher apathy (62.01%), depression (52.11%), and irritability (44.73%).
Mixed dementia featured increased apathy (61.65%), depression (45.68%), sleep disturbances
(44.63%), and more hallucinations (26.64%). VCI non-dementia (VCI-ND) was associated
with depression (44.97%), irritability (32.75%), and anxiety (30.07%).
CONCLUSION: BPSD are prevalent across VCI subtypes but vary. Mixed dementia features more hallucinations
and sleep disturbances, likely due to overlapping vascular and neurodegenerative pathology.
Apathy and agitation in subcortical VCI may reflect vascular burden. Further research
is warranted to clarify underlying neurobiological mechanisms.
SYSTEMATIC REVIEW REGISTRATION: PROSPERO CRD42024587171
Keywords: Vascular cognitive impairment; vascular dementia; mixed dementia; neuropsychiatric inventory.
FIGURES
| Note: How to cite this article: Santos AP, Lôbo AOM, Santos CBAL, Carvalho MGNC, Ribeiro MMC, Rodrigues AEO, et al. Behavioral and psychological symptoms of dementia associated with vascular impairment: a systematic review and meta-analysis. Braz J Psychiatry. 2025;47:e20254225. http://doi.org/10.47626/1516-4446-2025-4225 |
| Received: March 12 2025; Accepted: May 9 2025 |
INTRODUCTION
Dementia is a major neurocognitive disorder that comprises different pathologic substrates and cognitive presentation syndromes. It is estimated that 55 million people worldwide currently live with dementia, and this number is estimated to grow by 10 million new cases each year.1 Behavioral and psychological symptoms of dementia (BPSD) are reported in about 60-90% of these patients and increase the risk of hospitalization, caregiver burden, and patient distress.2 Several studies have demonstrated considerable variation in BPSD across different etiologies, such as vascular cognitive impairment (VCI), Alzheimer's disease (AD), Lewy bodies disease (LBD), and frontotemporal dementia (FTD).3,4 Historically, this variance proved essential in understanding the natural history and differential diagnosis of cognitive syndromes and their proper management in clinical care. Although VCI is considered the second most common cause of dementia after AD, BPSD have not been thoroughly investigated in this condition.
VCI can be defined as any cognitive or behavioral impairments related to a vascular brain injury, such as ischemia or hemorrhage, and is commonly classified as stroke-related, mixed, cortical multi-infarct dementia, and subcortical ischemic vascular dementia.5,6 VCI can also be classified according to its stage, ranging from asymptomatic (e.g., brain at risk) to mild cognitive impairment (MCI) to vascular dementia (VaD).6 On this basis, it is hypothesized that BPSD may vary according to the degree and etiology of the underlying VCI. For instance, apathy and depression are commonly associated with the progression of white-matter hyperintensities (WMH), leading to subcortical network disruption.7-14 However, the frequency and neurobiology of other commonly reported BPSD, such as anxiety, sleep disturbances, and irritability, are poorly understood, with fewer studies investigating their association with vascular burden.15,16
Even though a previous meta-analysis investigated the general range of BPSD among all-cause dementia patients, the current literature lacks an investigation of VCI using a similar analytical approach.9 Supporting the idea that the distinction of BPSD profiles might elucidate their pathological substrates, with clinical implications, we aimed to determine the prevalence of BPSD in VCI subtypes and stages and how their occurrence differed. The pathophysiology of these symptoms was approached narratively.
METHODS
Registration and protocol
While conducting this research, we followed the Preferred Reporting Items for Systematic Reviews and Meta-Analysis (PRISMA) guidelines and recommendations from the Cochrane Collaboration.17 This review was registered on the International Prospective Register of Systematic Reviews (PROSPERO) under CRD42024587171 to ensure further transparency. No protocol for this study was published beforehand.
Eligibility criteria
We searched for articles that assessed the prevalence of neuropsychiatric symptoms in patients with a diagnosis of VCI. Randomized controlled trials, cohort studies, and cross-sectional studies were included. Also, patients with a VaD diagnosis were required to have met the criteria defined by the third, fourth, or fifth edition of the DSM, the National Institute of Neurological Disorders and Stroke-Association International pour la Recherche et l'Enseignement en Neurosciences (NINDS-AIREN), or the Brazilian Academy of Neurology.6,18-21 Furthermore, studies were only eligible if they employed the Neuropsychiatric Inventory (NPI)22 to assess and categorize BPSD.
We excluded all records that did not meet the study design criteria, such as reviews, meta-analyses, case reports, opinion pieces, and guidelines. We also excluded abstracts and studies with overlapping populations. No restrictions were set concerning publication date, language, or geographic region where the research was conducted.
Search strategy
In May 2024, the reviewers comprehensively searched the PubMed, Embase, and Web of Science databases. To compose the search strategy and follow the specific search rules of each database, Medical Subject Headings (MeSH) terms and keywords were adapted accordingly. Terms were combined by Boolean operators (AND, OR), as can be seen in full detail in Supplementary Table S1. To ensure completeness, we also assessed the references of included articles and published literature reviews in search of eligible records.
After searching the databases and reviewing references from the literature, we used Rayyan reference management software to organize the retrieved records and eliminate duplicate entries.23 Then, two reviewers (APS and CBALS) independently screened the titles and abstracts of the remaining studies against our predetermined eligibility criteria. A third reviewer (AOML) resolved any disagreements.
Data extraction
To summarize the main findings, the authors independently extracted data from the included articles: authors and year of publication, study design, and baseline clinical data of the patient sample, encompassing type of VCI, age, years of education, Mini-Mental State Examination (MMSE) score, and Clinical Dementia Rating (CDR) scale. The endpoint of interest was the proportion of patients presenting each of the symptoms that compose the NPI at baseline, namely 1) delusions, 2) hallucinations, 3) agitation/aggression, 4) depression/dysphoria, 5) anxiety, 6) elation/euphoria, 7) apathy/indifference, 8) disinhibition, 9) irritability/lability, 10) aberrant motor behavior, 11) sleep and nighttime disorders, and 12) appetite and eating disorders.
Patients were divided into four different groups. If the study applied the aforementioned diagnostic criteria but did not subclassify VaD, the patients were put in the unspecified (general) VCI group. Those with evidence of subcortical impairment were put in the subcortical VaD group. Patients with a combination of VaD and any other etiology of dementia, such as AD, FTD, or LBD, were categorized as having mixed dementia, as proposed by the Vascular Impairment of Cognition Classification Consensus Study (VICCCS).5 Patients with evidence of VCI who met the DSM or NINDS-AIREN criteria for MCI or non-dementia VCI were deemed as having VCI non-dementia (VCI-ND). All data were exported to a Microsoft Excel spreadsheet and reviewed to ensure accuracy and completeness.
Quality and methodological assessment
Four reviewers (APS, CBALS, BHCCF, MMCR) individually assessed the methodological quality of the included studies. The tool of choice for randomized controlled trials was the Cochrane Collaboration's risk of bias tool (RoB 2).24 At the same time, cohort and cross-sectional studies were evaluated using the U.S. National Heart, Lung, and Blood Institute (NHLBI) Quality Assessment Tool for Observational and Cross-Sectional Studies.25 Study quality was classified as poor, fair, or good according to potential bias or flaws in the studies' methods. The reviewers also evaluated the possibility of publication bias and small-study effects by employing funnel plots and the Thompson-Sharp linear regression test.26
Statistical analysis
To obtain a truthful estimate of the overall prevalence of BPSD in patients with VCI, a random-effects model single-arm meta-analysis was performed using the "meta" and "metaphor" packages in R (version 4.3.2).27 The reported prevalences from the studies for each symptom of the NPI were subjected to a logit transformation. The weights for each study were calculated according to the inverse variance method. The extent of heterogeneity was evaluated using the t2 statistic, which quantifies the variability in true effects, and the I2 statistic, which indicates the proportion of variation attributable to heterogeneity.28 Heterogeneity was deemed significant if the p-value was below 0.10 or if I2 exceeded 25%.
To investigate how much each study influenced the overall result and heterogeneity, a sensitivity analysis by the leave-one-out method was conducted. Also, to identify the correlation of the sample's specific baseline characteristics with the observed results, a meta-regression was performed for those endpoints with at least 10 observations, ensuring adequate statistical power. The logit-transformed prevalences and their respective 95% confidence and prediction intervals were back-transformed for presentation.
RESULTS
Search results and characteristics of the included studies
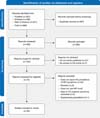
Our search found 986 papers, of which 487 were excluded for being duplicates. Of the remaining 499 reports, 75 were eligible for full-text review after title and abstract screening. After applying our eligibility criteria, 35 studies were included in the systematic review and meta-analysis, comprising 47 study populations and 5,805 participants. A step-by-step flow diagram of our search strategy is given in Figure 1.3,4,29-61

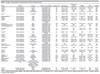
Of the 35 included studies, 32 were cross-sectional, two were prospective cohort studies, and one was a randomized controlled trial. Regarding the 47 study populations included in this systematic review and meta-analysis, we identified 30 populations with unspecified (general) VCI, seen with subcortical impairment; seven with mixed-dementia impairment; and three with VCI-ND. These populations were distributed across 21 countries and four continents, predominantly Europe (11 countries) and Asia (eight countries). Concerning sample characteristics, mean age ranged from 58.05 to 81.50 years; years of education, from 2.84 to 12.80 years; and MMSE and CDR scores, from 13.22 to 25.80 and 0.68 to 1.98, respectively. Study characteristics and patient data are reported in Table 1. The results by NPI domains for each cognitive impairment type are summarized in Table 2.
| Study | Design | Country | Type of VCI assessed | Patients (n) | Age (years) | Education (years) | MMSE | CDR | Quality |
|---|---|---|---|---|---|---|---|---|---|
| Akyol29 | Cross-sectional | Turkey | Unspecified VaD | 29 | 74.17±10.49 | 7.69±4.40 | 18.07±8.44 | 1.28±0.53 | Fair |
| Alves30 | Cross-sectional | Brazil | Subcortical VaD | 20 | 75.35±7.31 | 7.40±4.84 | 21.00±5.70 | NR | Fair |
| Amoo31 | Cross-sectional | Nigeria | Unspecified VaD | 18 | 64.50±8.70 | NR | NR | NR | Fair |
| Amr32 | Cross-sectional | Saudi Arabia | Unspecified VaD, mixed dementia | 23 | 69.90±5.60 | NR | 16.70±5.50 | 1.91±0.79 | Fair |
| Anor33 | Cross-sectional | Canada | Unspecified VaD, mixed dementia | 88 | 79.60±8.80 | 12.60±4.30 | 23.80±5.20 | NR | Fair |
| Bandyopadhyay34 | Cross-sectional | India | Unspecified VaD | 50 | 59.58±6.56 | 12.06±2.53 | 15.48±2.47 | 1.89±0.65 | Fair |
| Bhat35 | Cross-sectional | India | Unspecified VaD | 76 | 58.05±5.73 | NR | NR | 1.65±0.75 | Fair |
| Caputo4 | Cross-sectional | Italy | Unspecified VaD | 131 | 77.90±6.90 | 5.60±4.20 | 15.00±6.20 | 1.98±0.63 | Fair |
| Chiu36 | Cross-sectional | Taiwan | Unspecified VaD, mixed dementia, VCI-ND | 157 | 71.00±10.20 | 6.30±4.70 | 17.40±8.10 | 1.20±0.80 | Poor |
| D'Onofrio37 | Cross-sectional | Italy | Unspecified VaD | 136 | 80.81±6.94 | 3.55±3.15 | 16.35±5.04 | 1.59±0.91 | Fair |
| Fernández-Martínez38 | Cross-sectional | Spain | Unspecified VaD | 14 | NR | NR | NR | NR | Fair |
| Fernández-Martínez39 | Cross-sectional | Spain | Unspecified VaD, subcortical VaD | 28 | 72.49±7.74 | 9.32±3.15 | 19.39±2.51 | NR | Fair |
| Fonseca40 | Cross-sectional | Brazil | Mixed dementia | 14 | 75.10±7.60 | NR | 14.60±4.70 | NR | Fair |
| Fuh41 | Cross-sectional | Taiwan | Unspecified VaD, subcortical VaD | 196 | 75.20±7.20 | NR | 14.90±7.10 | NR | Fair |
| Gupta42 | Cross-sectional | India | Unspecified VaD, VCI-ND | 60 | 58.80±12.30 | 7.90±5.10 | NR | NR | Fair |
| Hsieh43 | Cross-sectional | Taiwan | Unspecified VaD | 77 | 71.40±6.70 | NR | 16.20±5.10 | 1.36±0.49 | Fair |
| Ikeda44 | Cross-sectional | Japan | Unspecified VaD | 28 | 81.00±5.90 | NR | 18.10±6.10 | 1.52±0.74 | Fair |
| Johnson3 | Cross-sectional | United States | Unspecified VaD, mixed dementia | 177 | 74.40±8.30 | 12.80±3.80 | NR | 1.50±0.70 | Fair |
| Jung45 | Cross-sectional | South Korea | Subcortical VaD | 48 | 71.80±7.20 | 8.50±4.80 | 21.60±4.40 | 0.85±0.74 | Good |
| Kazui46 | Cross-sectional | Japan | Unspecified VaD | 191 | 75.90±10.0 | 10.80±2.70 | 19.60±5.00 | 1.22±0.72 | Fair |
| Kim47 | Cross-sectional | South Korea | Subcortical VaD, VCI-ND | 127 | 73.80±6.90 | 8.90±5.30 | 23.30±4.83 | NR | Good |
| Lyketsos48 | Cross-sectional | United States | Unspecified VaD | 62 | NR | NR | NR | NR | Fair |
| Manso-Calderón49 | Cross-sectional | Spain | Unspecified VaD, subcortical VaD | 320 | 80.10±6.90 | 12.60±3.00 | 18.20±6.40 | 1.77±0.71 | Fair |
| Mukherjee50 | Cross-sectional | India | Unspecified VaD, mixed dementia | 18 | 66.20±8.10 | NR | NR | 1.81±0.82 | Fair |
| Perri51 | Cross-sectional | Italy | Subcortical VaD | 22 | 72.10±10.90 | 8.80±4.30 | 22.70±2.70 | 0.90±0.60 | Fair |
| Porter52 | Cross-sectional | United States | Unspecified VaD | 43 | 75.10±9.80 | 12.80±4.20 | 19.50±6.90 | NR | Poor |
| Ricci53 | Cross-sectional | Italy | Unspecified VaD, mixed dementia | 80 | NR | NR | NR | NR | Fair |
| Santos54 | Cross-sectional | Brazil | Unspecified VaD | 53 | 76.70±9.40 | NR | NR | 1.87±0.67 | Fair |
| Schwertner55 | Cross-sectional | Sweden | Unspecified VaD | 1,708 | 81.50±7.20 | NR | 20.10±4.90 | NR | Fair |
| Sep56 | Prospective cohort | Netherlands | Unspecified VaD | 575 | 68.40±8.30 | NR | 25.80±2.80 | 0.68±0.37 | Good |
| Siqueira-Neto57 | Cross-sectional | Brazil | Unspecified VaD | 234 | 67.77±10.35 | 2.84±2.96 | 13.22±7.00 | NR | Fair |
| Srikanth58 | Cross-sectional | India | Unspecified VaD | 31 | 59.60±9.90 | NR | 17.60±4.70 | 1.70±0.50 | Fair |
| Stakenborg59 | Randomized controlled trial | Austria, Canada, France, Germany, Italy, Russia, Spain, Switzerland, United Kingdom, United States | Unspecified VaD | 484 | 72.60±8.20 | 9.30±4.10 | 19.00±4.00 | NR | Good |
| Xing60 | Prospective cohort | China | Unspecified VaD | 457 | 66.79±10.48 | 6.71±4.81 | 15.39±5.58 | NR | Good |
| Yadav61 | Cross-sectional | India | Unspecified VaD | 30 | 75.50±6.70 | NR | N.R | NR | Poor |
CDR = Clinical Dementia Rating; MMSE = Mini Mental State Examination; NR = not reported; VaD = vascular dementia; VCI = vascular cognitive impairment; VCI-ND = vascular cognitive impairment-non-dementia.
| VCI group/NPI domain | No. of patients | Frequency (per 100 observations) | 95%CI | I2 | 95%PI |
|---|---|---|---|---|---|
| General | |||||
| Delusions | 4,527 | 19.31 | 15.26-24.12 | 90 | 5.80-48.18 |
| Hallucinations | 4,527 | 14.80 | 11.63-18.65 | 87 | 4.59-38.56 |
| Agitation/aggression | 4,937 | 37.61 | 32.08-43.48 | 92 | 15.00-67.31 |
| Depression/dysphoria | 4,858 | 43.48 | 38.41-48.68 | 89 | 21.59-68.24 |
| Anxiety | 4,900 | 33.85 | 29.51-38.48 | 86 | 16.24-57.45 |
| Elation/euphoria | 4,658 | 9.02 | 7.07-11.44 | 76 | 3.37-21.97 |
| Apathy/indifference | 4,994 | 54.29 | 47.22-61.19 | 94 | 20.75-84.35 |
| Disinhibition | 4,532 | 19.81 | 16.00-24.27 | 86 | 7.08-44.47 |
| Irritability/lability | 4,989 | 38.76 | 32.87-45.01 | 93 | 14.42-70.40 |
| Aberrant motor behavior | 4,851 | 21.42 | 16.43-27.43 | 94 | 4.99-58.61 |
| Sleep and nighttime behavior disorders | 4,350 | 38.43 | 31.55-45.80 | 94 | 12.93-72.40 |
| Appetite and eating disorders | 4,453 | 27.32 | 22.70-32.49 | 89 | 11.41-52.31 |
| Subcortical | |||||
| Delusions | 526 | 23.18 | 16.93-30.88 | 63 | 9.09-47.67 |
| Hallucinations | 526 | 15.48 | 9.64-23.92 | 70 | 3.75-46.28 |
| Agitation/aggression | 526 | 43.18 | 38.98-47.48 | 0 | 37.70-48.83 |
| Depression/dysphoria | 526 | 52.11 | 42.15-61.91 | 76 | 26.60-79.31 |
| Anxiety | 526 | 41.50 | 33.09-50.44 | 69 | 19.30-67.78 |
| Elation/euphoria | 506 | 8.72 | 5.25-14.14 | 51 | 2.21-28.78 |
| Apathy/indifference | 526 | 62.01 | 51.93-71.16 | 75 | 31.21-85.45 |
| Disinhibition | 526 | 25.91 | 22.34-29.83 | 0 | 21.30-31.12 |
| Irritability/lability | 526 | 44.73 | 35.11-54.6 | 76 | 18.59-74.14 |
| Aberrant motor behavior | 504 | 21.38 | 16.10-27.83 | 50 | 9.57-41.16 |
| Sleep and nighttime behavior disorders | 504 | 36.95 | 24.72-51.12 | 86 | 7.99-79.83 |
| Appetite and eating disorders | 504 | 34.16 | 28.37-40.46 | 39 | 20.87-50.50 |
| Mixed | |||||
| Delusions | 228 | 28.61 | 19.91-39.25 | 50 | 10.01-59.07 |
| Hallucinations | 228 | 26.64 | 15.50-41.81 | 72 | 4.13-75.38 |
| Agitation/aggression | 228 | 38.00 | 30.23-46.43 | 25 | 22.59-56.27 |
| Depression/dysphoria | 228 | 45.68 | 32.77-59.19 | 67 | 14.07-81.19 |
| Anxiety | 228 | 40.90 | 28.28-54.84 | 68 | 11.34-79.91 |
| Elation/euphoria | 186 | 8.49 | 5.17-13.63 | 0 | 2.81-22.95 |
| Apathy/indifference | 228 | 61.65 | 52.71-69.87 | 31 | 41.07-78.77 |
| Disinhibition | 193 | 22.44 | 15.34-31.60 | 29 | 8.12-48.65 |
| Irritability/lability | 228 | 40.44 | 32.44-48.98 | 26 | 24.29-58.97 |
| Aberrant motor behavior | 136 | 27.25 | 16.43-41.66 | 55 | 5.53-70.57 |
| Sleep and nighttime behavior disorders | 136 | 44.63 | 33.54-56.28 | 36 | 20.11-72.07 |
| Appetite and eating disorders | 136 | 25.82 | 19.00-34.07 | 0 | 16.60-37.85 |
| VCI-ND | |||||
| Delusions | 128 | 11.40 | 4.09-27.96 | 64 | 0.00-100.00 |
| Hallucinations | 69 | 2.95 | 0.74-11.04 | 0 | - |
| Agitation/aggression | 128 | 15.53 | 9.29-24.82 | 29 | 0.10-97.03 |
| Depression/dysphoria | 128 | 44.97 | 22.10-70.18 | 87 | 0.00-100.00 |
| Anxiety | 128 | 30.07 | 19.95-42.59 | 49 | 0.17-99.10 |
| Elation/euphoria | 69 | 4.96 | 1.60-14.34 | 0 | - |
| Apathy/indifference | 128 | 19.07 | 11.50-29.04 | 35 | 0.09-98.36 |
| Disinhibition | 128 | 7.20 | 3.79-13.28 | 0 | 0.10-86.36 |
| Irritability/lability | 128 | 32.75 | 23.85-43.09 | 27 | 1.03-95.80 |
| Aberrant motor behavior | 69 | 7.26 | 1.25-32.59 | 63 | - |
| Sleep and nighttime behavior disorders | 128 | 19.57 | 3.03-65.42 | 93 | 0.00-100.00 |
| Appetite and eating disorders | 128 | 25.14 | 12.31-44.55 | 76 | 0.00-99.99 |
95%PI = 95% prediction interval; NPI = Neuropsychiatric Inventory; VCI-ND = vascular cognitive impairment-non-dementia.
Quality assessment
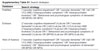
Overall, five studies were assessed as having good quality, 27 as fair quality, and three were deemed poor quality across all domains. The main biases identified were insufficient sample size justification, lack of blinding of outcome assessors, and inadequate control for confounding variables. The detailed evaluations for each study can be seen in Supplementary Table S2.
Regarding publication bias and small-study effects, a funnel plot analysis was performed for each NPI domain in the unspecified VCI group since it was the only group with at least 10 observations. Significant asymmetry was only observed for elation/euphoria (bias estimate: -1.44, p = 0.014). For delusions (bias estimate: -1.28, p = 0.062), hallucinations (bias estimate: -1.06, p = 0.124), agitation/aggression (bias estimate: -0.17, p = 0.828), depression/dysphoria (bias estimate: -1.03, p = 0.151), anxiety (bias estimate: -0.36, p = 0.565), apathy/indifference (bias estimate: 1.60, p = 0.077), disinhibition (bias estimate: -0.87, p = 0.237), irritability/lability (bias estimate: -0.26, p = 0.761), aberrant motor behavior (bias estimate: -0.826, p = 0.347), sleep and nighttime behavior disorders (bias estimate: -1.60, p = 0.073), and appetite and eating disorders (bias estimate: -0.05, p = 0.947), no significant asymmetries were observed according to the Thompson-Sharp test. The funnel plots are shown in Supplementary Figure S1.
Sensitivity analysis
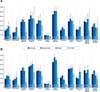
Sensitivity analysis by the leave-one-out method did not significantly modify the pooled prevalence of any BPSD independently of the group. To investigate the effect of heterogeneity on the results, we performed a second synthesis of the articles, this time omitting the study that most reduced the I2 statistic in the sensitivity analysis for each BPSD. The results of each sensitivity analysis are presented in Supplementary Figure S2, and the second synthesis is compared with the first in Figure 2, with further details provided in Supplementary Table S3.

Meta-regression
A meta-regression analysis was performed for all NPI domains in the unspecified VCI group in search of significant associations between the logit-transformed prevalences and baseline characteristics of the sample, namely mean age, years of education, MMSE score, and CDR. Years of education correlated positively with the prevalence of agitation/aggression (R2: 67.04%, slope: 0.088, p < 0.001) and disinhibition (R2: 60.84%, slope: 0.137, p = 0.010). A significant association was also seen between the mean MMSE score and irritability/lability (R2: 28.69%, slope: 0.115, p = 0.007). Although marginally non-significant, associations were also found between years of education and anxiety (R2: 7.30%, slope: 0.090, p = 0.060) as well as elation/euphoria (R2: 46.75%, slope: 0.087, p = 0.069). No other correlations were statistically significant (all p > 0.05). All meta-regression results can be found in Supplementary Figure S3.
DISCUSSION
Our study is the first meta-analysis to compare different behavioral and psychological features across subtypes and stages of VCI. This research builds on a previous systematic review that examined BPSD across various VCI types.7 However, we identified several studies published after that review that could expand the existing evidence base. Although numerous papers documented the presentation of these symptoms in cross-sectional studies, there was a gap in the literature of a convergent and extensive analysis of BPSD prevalence in VCI. As a result, the present work integrates multiple studies with a robust analytical approach and includes epidemiological aspects not covered in earlier studies. It makes a relevant contribution to the field by exploring the frequency of BPSD in 35 studies covering 5,805 individuals. Furthermore, we contrasted how the frequencies behaved among the different types of VCI (unspecified, subcortical, VCI-ND, and mixed pathologies), allowing us to discuss potential mechanisms to explain the heterogeneity of neuropsychiatric symptoms in VCI.
As a main result, our meta-analysis showed no significant differences in occurrence between BPSD within most groups of VCI. Noteworthy, VCI-ND prevalences differed from those of the unspecified VCI group for hallucinations and from those of all other groups regarding apathy/indifference, disinhibition, and agitation/aggression. Thus, it is reasonable to assume that these features do not indicate differential diagnosis among the VCI types compared, especially within dementia groups. However, the isolated prevalence of each of these symptoms largely varied. That might indicate different underlying mechanisms for their development, and, in case of symptoms with high concurrent prevalences, such as apathy, depression, sleep disturbances, irritability, and agitation/aggression, superposing underlying mechanisms should be considered.
Agitation in AD has been theorized as a dysfunction associated with atrophy in the left insula and anterior cingulate cortex and overall neurodegeneration in the anterior salience network.62,63 Meanwhile, resting-state functional magnetic resonance imaging (fMRI) analysis suggested agitation was linked to increased activity in the left superior cingulate and paracingulate gyri.64 A previous cohort study correlated the impact of subcortical vascular insult on the occurrence of agitation, although the result was not statistically significant. Yet, the same study found an association between baseline temporal and frontal WMH and agitation severity score, indicating it can result from or increase with WM disruption.33 Our results showed a high prevalence of agitation/aggression in subcortical VCI; therefore, further investigation into the role of subcortical circuits in agitation/aggression is necessary, with additional imaging research on specific WMH localization being crucial.
Our findings also support previous studies indicating that apathy can be due to subcortical disconnection related to vascular burden, as the prevalences of this symptom were high in the general VaD group and in the subcortical group, while being significantly lower for VCI-ND.11-13 Since small-vessel disease (SVD) is the main contributor to VCI, the overall VCI prevalences are expected to reflect those of SVD.65 The general VaD and subcortical groups' prevalences did not differ significantly from those of the mixed pathology group. This, and the significant prevalence of mixed pathology described in the literature, might corroborate the leading theories for the genesis of such diseases, such as "the two-hit hypothesis" proposed by Zlokovic in 2011, in which both AD and VCI might be connected disorders or have intricate pathophysiology. In this matter, our results support the idea that behavioral and psychological profiles cannot and should not be used to differentiate mixed dementias from pure VCI.66,67
Given that mixed pathology may not always be distinguished through clinical and radiological evaluation alone, we anticipate future research incorporating biomarkers indicative of degenerative processes - such as beta-amyloid and phosphorylated tau - will provide greater insight. This could facilitate accurate differentiation between patients with VaD and those with mixed dementia, thereby enhancing our understanding of the psychological and behavioral profiles associated with each condition.68,69
Regarding VCI, particularly SVD, disrupted functional connectivity (FC) in specific networks - the dorsal attention network (DAN), the default-mode network (DMN), and the frontoparietal control network (FPCN) - correlated with an increased degree of cognitive impairment.70 Neuroimaging studies specifically evaluating apathy in VCI have discussed whether it may occur as a syndrome apart from depression and cognitive decline, resulting from WM disconnection due to SVD.71 A pathway analysis using diffusion tensor tractography showed that patients with apathy, but not depression, had reduced measures of network density and efficiency throughout the whole brain.72 More recent research on comparative resting-state FC between SVD and AD patients further elaborates on this disconnection theory, showing distinct FC in the salience network in SVD. Specific regions, such as the middle frontal gyri and the anterior insula, were identified as central hubs for apathy genesis.73
Excluding outliers, which can skew the study results and increase heterogeneity, we found a noticeable prevalence of sleep and nighttime disorders across different stages of dementia. This is particularly evident in the VaD and mixed dementia groups, with a higher prevalence observed in those with mixed pathology. In this regard, prior research found that AD patients who experienced more sleep disturbances also had greater WMH.15 This included a higher WMH load overall and specifically in the frontal and occipital regions. In parallel, a study examining WM in non-dementia patients with insomnia noted decreased integrity in the left thalamus and pars triangularis tracts.74 Alterations in the ventrolateral preoptic area in the anterior hypothalamus and the suprachiasmatic nucleus have also been correlated with sleep changes in dementia.75 These findings suggest that sleep disturbances could be associated with vascular burden and WM disconnection. However, other environmental and psychological aspects might also predispose to sleep alterations independent of structural changes.76
The relatively low frequency of hallucinations in both general VaD and VCI-ND can be attributed to the selective nature of the vascular pathology. Psychotic symptoms are more common in diseases such as LBD and Parkinson's disease dementia, with a complex neurobiology that involves dysfunction in the dopaminergic and cholinergic systems and deafferentation of posterior cortical areas linked to perceptual processing.77 That contrasts with the mixed-dementia group, where hallucinations were more prevalent in absolute terms. The co-occurrence of AD, which often affects perceptual regions like the temporoparietal cortex and visual association areas, might exacerbate perceptual symptoms. In the subcortical group, hallucinations could be linked to the selective involvement of subcortical structures, such as the thalamus and basal ganglia, and even the connections between posterior associative areas that contribute to sensory integration and cognitive processing.77 Disruption of these circuits could result in perceptual disturbances less frequently than in dementias with primarily dopaminergic involvement.78 As previously described, vascular lesions to the cortex and disruption of subcortical networks, leading to remote alterations such as a reduction in grey-matter volume and subsequent disruption of the functional interconnectivity of the thalamus, limbic, paralimbic, and other subcortical structures, might account for such perceptual disturbances and generate psychotic symptoms.70,79,80 In general, although previous studies reported an association of cerebral amyloid angiopathy (CAA) and SVD with psychotic symptoms in AD, the contribution of vascular pathology to this phenomenon in dementia requires further investigation.79
In VCI-ND, apathy, disinhibition, hallucinations, and agitation/aggression rates were significantly lower than in other groups, which suggests an association of these symptoms with dementia progression and increased vascular burden. However, we must stress that the small number of studies addressing VCI-ND and their relatively small sample sizes might constitute a limitation. Beyond that, this observation could be further elucidated by comparing groups with varying levels of vascular load and cognitive impairment, as measured by the Fazekas scale.81 Depression was a widespread symptom across every group. Fang et al.82 found that SVD features might increase the risk for incident depression. Moreover, alongside molecular, inflammatory, and endothelial-dysfunction mechanisms, some studies support depression as a result of damage to frontal-subcortical circuits.83-85 An fMRI study with depressed SVD patients revealed that these individuals' brains have unstable dynamic FC states, alongside hyperconnectivity in the lateral visual network and reduced connectivity between the ventral attention network and the sensorimotor network. The high prevalence of depression in VCI-ND might reflect an early dysfunction of these networks and circuits.86 In this context, we believe that vascular risk factors and cerebrovascular disease could precipitate the development of depression, as predicted in the vascular depression hypothesis.11 The persistence of this symptom across dementia stages also corroborates studies indicating that greater WMH is associated with worsening depressive states and poorer response to antidepressants.87-90
Regarding the correlation with cognitive decline, our meta-regression revealed that lower MMSE scores are not associated with a higher prevalence of BPSD other than irritability/lability. In that respect, a cross-sectional study of cognitively unimpaired older adults with severe WMH found that the odds of having elation, disinhibition, agitation, and anxiety were higher compared to groups with less WMH.91 Interestingly, in our study, years of education correlated positively with the prevalence of agitation/aggression, anxiety, euphoria, and disinhibition. Few studies have investigated the relationship between education and the severity of neuropsychiatric symptoms in dementia.92-94 Although cognitive reserve has been associated with less deleterious effects of neurodegenerative pathology in cognition, the same could not be said for BPSD.95 In contrast to our results, a multivariate analysis found years of education (as a proxy of cognitive reserve) may attenuate the severity of affective and behavioral symptoms in dementia.92
Our study has limitations that must be taken into account. The absence of a control group is a notable shortcoming, especially considering the high prevalence of mood disorders among older adults, regardless of cognitive status.96 Furthermore, the limited number of longitudinal studies hindered our ability to accurately capture the timing of symptom onset during disease progression. Also, the sample size of patients with VCI-ND was relatively small. Additionally, the reviewers did not search grey literature, which may have led to the omission of relevant unpublished or non-indexed studies. Given that cerebrovascular disease represents a continuum that may affect patients over many decades, it is crucial that studies longitudinally approach BPSD that may arise in this continuum, including before the onset of cognitive symptoms. It is noteworthy that the NPI is a subjective questionnaire; therefore, it is subject to information bias. Since it was developed to assess dementia patients, it may not be the most accurate tool for those with VCI-ND.
To address the trajectory of BPSD across the spectrum of VCI, especially within VCI-ND, we recommend that future studies prioritize longitudinal designs. Accurate differentiation between VCI subtypes and mixed pathology might require integrating neuroimaging with biomarkers indicative of neurodegenerative processes, complemented by thorough, detailed cognitive assessments. Additionally, exploration of the mechanisms underlying specific BPSD through functional neuroimaging is crucial for elucidating the basis for these symptoms' heterogeneity and for developing targeted therapeutic strategies.
To date, studies have most consistently utilized the NPI to assess the presence of neuropsychiatric symptoms. Scales evaluating the presence of BPSD more comprehensively, such as the Cohen-Mansfield Agitation Inventory (CMAI), which assesses 29 behavioral changes commonly observed in dementias, may provide more detailed information regarding the neuropsychiatric profile of patients across different forms of VCI.97 This tool was not consistently explored in the studies included in our review, so validating this inventory in populations with VCI may support its inclusion in future research. Finally, the impact of vascular risk factors, extent of cerebrovascular disease (as quantified by objective measures), and individual characteristics (including educational attainment) on the occurrence and severity of BPSD requires further investigation, possibly including control groups of cognitively unimpaired older adults.
In this systematic review and meta-analysis, we elucidated the prevalence of BPSD across different types of VCI. There were no significant differences in occurrence between BPSD within most groups of VCI. Notably, the prevalences seen in the VCI-ND group differed from those of the unspecified VCI group for hallucinations and from those seen in all other groups for apathy/indifference, disinhibition, and agitation/aggression. In mixed dementia, hallucinations (26.64%) and sleep and nighttime disorders (44.63%) were more prevalent than in other VCI types.
Longitudinal follow-up of patients from the earliest stages of VCI, along with comparisons between individuals at different stages of cerebrovascular disease, will deepen our understanding of how these symptoms develop throughout the continuum of cerebrovascular disease.
SUPPLEMENTARY MATERIALS
ACKNOWLEDGEMENTS
During the preparation of this work, the author(s) used Grammarly to edit and correct grammar, spelling, and punctuation. After using this tool/service, the author(s) reviewed and edited the content as needed and take full responsibility for the content of the publication.
 PDF
 Print
 Send this article by email
 How to cite this article
 Submit a comment
 Mendeley
 Pocket
 Share on Facebook
 Share on Twitter