


ABSTRACT:
OBJECTIVE: To determine whether there are differences in the parameters triglyceride glucose
index (TyG), triglyceride glucose-body mass index (TyG-BMI), and metabolic score index
for insulin resistance (METS-IR) between subgroups of patients diagnosed with bipolar
disorder (BD) - in euthymic, manic, and depressive states - and healthy controls.
METHODS: A total of 238 patients diagnosed with BD and 90 healthy controls were included in
the study.
RESULTS: TyG-BMI was higher in depressed-state BD patients than in manic-state BD patients.
The METS-IR was significantly higher in depressed BD patients than in healthy controls.
TyG-BMI was a statistically significant predictor of euthymic and depressed states
of BD. In addition, the METS-IR was a statistically significant predictor of euthymic-state
BD, depressed-state BD, and BD overall. In the receiver operating characteristic (ROC)
analysis, we obtained the highest area under the ROC curve (AUC) values in the parameters
TyG-BMI and METS-IR to discriminate the patient groups from healthy controls.
CONCLUSION: This is the first study to provide evidence that elevated levels of METS-IR and TyG-BMI
may be an indicator of IR in BD patients and can be used to differentiate BD patients
from healthy controls. However, there is a need for confirmation of these results
in larger studies before definitive conclusions can be drawn.
Keywords: Bipolar disorder; insulin resistance; TyG; TyG-BMI; METS-IR.
FIGURES
| Note: How to cite this article: Cokunlu Y, Yucel K, Simsek F, Inanli I. Assessment of insulin resistance in different phases of bipolar disorder with the triglyceride glucose index, triglyceride glucose-body mass index, and metabolic score index for insulin resistance. Braz J Psychiatry. 2025;47:e20254179. Epub 2025 Jun 10. http://doi.org/10.47626/1516-4446-2025-4179 |
| Received: February 14 2025; Accepted: May 31 2025 |
INTRODUCTION
Bipolar disorder (BD) is a mood disorder characterized by recurrent manic and depressive episodes throughout life. Its prevalence is estimated to be 1-4% worldwide.1,2 Compared with the general population, patients diagnosed with BD have a higher risk of insulin resistance (IR), type 2 diabetes mellitus (T2DM), and the metabolic syndrome (MetS).3,4 In particular, T2DM is itself a major risk factor for cardiovascular disease and is associated with other risk factors for cardiovascular disease, including obesity and MetS.5 Cardiovascular diseases are known to be the leading cause of mortality in BD, which is associated with early death.6 In addition to increasing the risk of cardiovascular disease, comorbid T2DM also affects the course and progression of the disease. Studies have shown that patients with BD and T2DM are more likely to have rapid cycling, persistent course, and drug resistance.7-9 Like T2DM, IR has been shown to be common in patients diagnosed with BD and is associated with adverse clinical course and treatment outcomes.10 In patients with BD, high IR has been associated with both manic and depressive episodes.10,11 Calkin et al.10 emphasized that IR is an important factor in treatment resistance in BD. In a systematic review, IR was shown to cause early cognitive impairment in patients diagnosed with BD.12
IR plays an important role in the pathogenesis of T2DM, MetS, and cardiovascular disease.13-15 IR is defined as a diminished biological response to normal circulating insulin concentrations or to exogenously administered insulin. The early stages of IR are characterized by hyperinsulinemia with normoglycemia. Over time, however, insulin insufficiency develops as the ability of the pancreas to secrete insulin decreases.15-18 The gold-standard method for determining IR is the hyperinsulinemic euglycemic clamp method, but the high cost and invasive nature of this method make it difficult to use in practice.19 Although the homeostasis model assessment of insulin resistance (HOMA-IR), calculated by measuring fasting insulin and glucose, is widely used in clinical practice, its disadvantages are that it is affected by differences in insulin measurement and its low reproducibility.20 In recent years, parameters such as the triglyceride (TG)-glucose index (TyG), the triglyceride-glucose body mass index (TyG-BMI), and the metabolic score index of IR (METS-IR), calculated by combining blood lipids, fasting plasma glucose (FPG), and anthropometric measurements (height and weight), have been investigated as alternative indicators of IR.21-23 These insulin-independent parameters provide a simpler means of detecting IR. Studies have shown that the TyG and TyG-BMI indices are more effective than HOMA-IR for this purpose.24,25 In studies comparing METS-IR with the hyperinsulinemic euglycemic clamp method, which is the gold standard for detecting IR, METS-IR was found to be more accurate. In addition, METS-IR showed stronger correlations with the hyperinsulinemic euglycemic clamp method than with other insulin-independent IR indicators.26
Although IR and its cardiometabolic effects are common in patients with BD, few studies have investigated the relationship between IR and BD, and none have evaluated this relationship with parameters calculated independently of insulin, such as the TyG, TyG-BMI, and METS-IR. Within this context, the aim of the present study was to determine whether there are differences in TyG, TyG-BMI, and METS-IR between patients diagnosed with BD in euthymic, manic, and depressive states and healthy controls, as well as to detect a possible relationship between these parameters and disease severity and clinical features.
METHODS
Study population
This is a retrospective cross-sectional study. Data collection procedures were performed after approval from the relevant ethics committee and institutional approval from the hospital where the study was conducted. Patients diagnosed with BD who presented to the outpatient psychiatry clinic of Konya Numune Hospital between January 1, 2015, and January 1, 2025, in a euthymic, manic, or depressive state according to the DSM-5 diagnostic criteria were included in the study.27 Sociodemographic and clinical characteristics of the patients and laboratory results were obtained from the hospital's electronic medical record.
Patients with comorbidities (diagnosis of psychiatric disorder other than BD, diabetes, obesity, history of cardiovascular disease, presence of other chronic comorbidities, etc.) and those on medications other than those used to treat BD were excluded from the study. The patient group consisted of 238 patients diagnosed with BD: 76 patients in the euthymic state, 88 patients in the manic phase, and 74 patients in the depressive state.
The control group consisted of age- and sex-matched healthy subjects who were free of illness on routine examination, had no lifetime history of psychiatric disorder, and had never taken psychiatric medication. We obtained the data for the healthy control group from the hospital records of healthy individuals who matched our patient data, met the inclusion criteria, and presented to the outpatient clinic for health screening. BMI calculation, routine biochemistry, and complete blood counts were performed for health screening at our hospital. Participants with any psychiatric illness, asthma, bronchitis, pneumonia, chronic diseases (diabetes, obesity, history of cardiovascular disease, drug use, etc.) were excluded from the study. A total of 90 healthy participants were included in the study.
Data collection and definitions
Clinical data were collected retrospectively from medical records by trained clinicians in line with the study objectives. The manic and depressive groups consisted of patients who were followed up in the inpatient unit and underwent routine blood tests (complete blood count, biochemical parameters [lipids, FPG, thyroid, renal and liver function tests]) 1 day after admission. The euthymic group consisted of patients who were seen in the outpatient clinic every 3 months and had routine blood tests once a year. Blood samples were taken from all patients between 8 and 9 a.m. after an overnight fast. TG/FPG ratio, TG/HDL-C ratio, and TC/HDL-C ratio were calculated from laboratory results. BMI was calculated as weight divided by height squared (kg/m2).20 The TyG was calculated as ln (TG [mg/dL] × FPG [mg/dL]/2).21 The TyG-BMI was calculated as TyG × BMI.25 The METS-IR was calculated as ln ([2 × FPG {mg/dL}] + TG [mg/dL]) × BMI (kg/m2)/ln (HDL-C [mg/dL]).20
Statistical analysis of data
Data entry and statistical analysis were performed using PASW Statistics for Windows, version 18.0. Visual (histogram and probability plots) and analytical (Kolmogorov-Smirnov and Shapiro-Wilk tests) methods were used to analyze the conformity of the data to the normal distribution. Mean (SD) and median (interquartile range) values were used to evaluate numerical data; frequency distributions and percentages were used to summarize categorical data. The chi-square test was used to compare categorical data. One-way analysis of variance (ANOVA) was used to compare more than two groups with normally distributed numerical data. In groups with significant differences detected by one-way ANOVA test, appropriate post-hoc tests were performed according to the homogeneity of the variances to determine from which group the significance originated. The Kruskal-Wallis test was used to compare non-normally distributed numerical data with three or more groups. The post-hoc Mann-Whitney U test with Bonferroni correction was used for pairwise comparisons between groups with significant Kruskal-Wallis test results. For one-way ANOVA, eta squared (?2) was calculated as the effect size; ?2 < 0.01 was considered a very small effect size, 0.01-0.06 a small effect size, 0.06-0.14 a medium effect size, and > 0.14 a large effect size. For the Kruskal-Wallis test, a criterion similar to eta-squared (?2) was used in accordance with the non-parametric structure. This value was calculated using the formula ?2 = Kruskal-Wallis test value/(n-1) and interpreted using the same thresholds. As a result of the chi-squared test, Cramér's V coefficient was calculated to determine the strength of the relationship between the groups; V < 0.07 was considered very small, 0.07-0.21 small, 0.21-0.35 medium, and > 0.35 large effect size. In addition, Cohen's d was calculated as the effect size for independent-samples t-tests: d < 0.2 was considered a very small effect size, 0.2-0.5 a small effect size, 0.5-0.8 a medium effect size, and > 0.8 a large effect size. Correlations of non-normally distributed numerical variables were analyzed using the Spearman correlation coefficient. For Spearman correlation coefficients, 0.00-0.19 was considered as a very weak or insignificant correlation, 0.20-0.39 as a weak correlation, 0.40-0.69 as a moderate correlation, 0.70-0.89 as a strong correlation, and 0.90-1.00 as a very strong correlation. The diagnostic decision properties of METS-IR, TYG-BMI, TG/FPG levels in predicting the identified patients were analyzed by receiver operating characteristics (ROC) curve slope analysis. Significant cutoff values were determined using the Youden index (max[sensitivity+specificity-1]). The sensitivity, specificity, positive predictive value, and negative predictive value of the cutoff values were calculated. The area under the ROC curve (AUC) was classified as excellent for AUC values between 0.9 and 1, good for AUC values between 0.8 and 0.9, fair for AUC values between 0.7 and 0.8, poor for AUC values between 0.6 and 0.7, and unsuccessful for AUC values between 0.5 and 0.6. Logistic regression analysis was used to evaluate the effect of possible variables identified in binary analyses in predicting all patients and euthymic, manic, and depressive patients. The Hosmer-Lemeshow test was used to assess model fit. The type 1 error level was accepted as 5% for statistical significance.
Ethics statement
Ethics approval was obtained from the Non-Pharmaceutical and Non-Medical Device Research Ethics Committee of the Konya Chamber of Commerce Karatay University Faculty of Medicine, Konya, Turkey (Ethics Committee no. 2024/021, number of meetings 11, December 2, 2024).
RESULTS
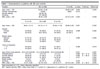
A total of 328 participants - 238 patients diagnosed with BD (76 euthymic, 88 manic, 74 depressive) and 90 healthy controls - were included in the study. The mean age of all participants was 36 (26-44) years. The patient and control groups were similar in terms of age and gender (p > 0.05). There were no smokers in the healthy control group, whereas 46.92% of patients diagnosed with BD were smokers. BMI and number of suicide attempts were significantly higher in BD patients in depressive state compared to BD patients in manic and euthymic states (p < 0.05) (Table 1). When the hospital database was analyzed, manic and depressive patients were found to have been hospitalized because they stopped their treatment. For this reason, data from the drug-free period were collected. All patients in the euthymic state were taking either valproic acid or lithium as a mood stabilizer; 22.36% of these patients were also taking antipsychotics.
| Variable | BD (n=238) | C (n=45) | p-value | Post-hoc | Effect size | ||
|---|---|---|---|---|---|---|---|
| Age, mean ± SD | 35.99±12.06 | 36.68±9.29 | 0.620 | - | 0.059 | ||
| Gender, female/male | 145/93 | 48/42 | 0.213 | - | |||
| Suicide attempt | 96 (40.78) | - | - | ||||
| Smoking | 107 (46.92) | - | - | ||||
| BMI, mean ± SD | 26.52±3.08 | 25.72±3.23 | 0.042 | - | 0.258 | ||
| D (n=74) | M (n=88) | E (n=76) | |||||
| Age, mean ± SD | 38.81±12.12 | 34.14±11.17 | 35.38±11.56 | 36.68±9.29 | 0.061 | 0.022 | |
| Gender | |||||||
| Female | 42 (56.8) | 56 (63.6) | 47 (61.8) | 48 (53.3) | 0.498 | 0.085 | |
| Male | 32 (43.2) | 36.4 (32.0) | 29 (38.2) | 42 (46.7) | |||
| Marital status | |||||||
| Married | 31 (41.9) | 33 (37.5) | 36 (47.4) | - | 0.365 | 0.095 | |
| Single | 31 (41.9) | 37 (42.0) | 33 (43.4) | - | |||
| Divorced | 12 (16.2) | 18 (20.5) | 7 (9.2) | - | |||
| Years of education | |||||||
| > 8 | 30 (40.5) | 37 (42.0) | 37 (48.7) | - | 0.558 | 0.070 | |
| = 8 | 44 (59.5) | 51 (58.0) | 39 (51.3) | - | |||
| Age of first mood episode | 24.0 (18.75-30.00) | 21.0 (18.00-28.00) | 22.5 (19.00-30.00) | - | 0.421 | 0.007 | |
| Hospitalizations | 2.0 (1-5) | 3.0 (1-5) | 1.5 (1-3) | - | 0.000 | M > D, E | 0.065 |
| Suicide attempt | 48 (64.9) | 31 (35.2) | 17 (22.4) | - | 0.000 | D > M, E | 0.353 |
| Seasonality | 28 (37.8) | 31 (35.2) | 24 (31.6) | - | 0.721 | 0.052 | |
| Rapid cycling | 4 (5.4) | 7 (8.0) | 4 (5.3) | - | - | 0.052 | |
| Smoking | 34 (45.9) | 42 (47.7) | 31 (40.8) | - | 0.444 | 0.090 | |
| BMI, mean ± SD | 27.21±2.62 | 25.74±3.53 | 26.72±2.77 | 25.72±3.23 | 0.004 | D > M, C | 0.040 |
Data presented as n (%), unless otherwise specified.
BD = bipolar disorder; BMI = body mass index; C = control; D = depressive; E = euthymic; M = manic.
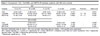
When we compared the data of the patient (n=238) and control (n=90) groups, there was no significant difference between the groups in terms of age, gender, FPG, TG, TC/HDL-C, TG/LDL-C, TG/FPG, TyG, or TyG-BMI (p > 0.05). However, TC, HDL-C, and LDL-C levels were found to be significantly lower in the patient group than in healthy controls, and BMI and METS-IR levels were found to be significantly higher in the patient group than in healthy controls (p < 0.05).
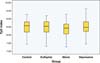
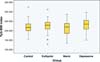
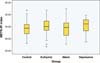
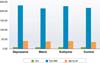
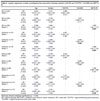
When the four groups were compared, no differences were found in terms of age, BMI, FPG, TG, TC/HDL-C, TG/LDL-C, or TyG. TC, HDL-C, LDL-C, TG/FPG, TyG-BMI and METS-IR, however, were significantly different between groups. HDL-C levels were significantly higher in the healthy control group than in the other groups. LDL-C levels were significantly higher in the depressed-state BD group and in the healthy controls than in the manic- and euthymic-state BD groups (Tables 2 and 3). There was no difference in TyG between groups (Figure 1). TyG-BMI was higher in depressed BD patients than in manic BD patients (Figure 2). The METS-IR was significantly higher in depressed BD patients than in healthy controls (Figure 3). Figure 4 shows the comparison of all groups for TyG, TyG-BMI, and METS-IR.| BD | |||||||
|---|---|---|---|---|---|---|---|
| Variable | D (n=74) | M (n=88) | E (n=76) | C (n=45) | p-value | Post-hoc | Effect size |
| FPG | 87.21±16.56 | 86.98±12.77 | 89.06±10.05 | 86.94±9.89 | 0.669 | - | 0.004 |
| TC | 175.77±29.06 | 163.18±28.52 | 165.73±23.58 | 172.28±24.23 | 0.002* | D, C > M | 0.046 |
| TG | 121.50 (94.75-151.50) | 101.00 (74.00-144.00) | 116.50 (88.50-155.00) | 113.50 (87.75-154.25) | 0.600 | - | 0.022 |
| HDL-C | 42.00 (36.75-49.00 | 42.00 (35.00-49.00) | 43.00 (37.00-49.00) | 48.00 (40.00-54.00) | 0.030* | C > D, M, E | 0.027 |
| LDL-C | 106.77±24.73 | 94.70±27.04 | 92.52±21.06 | 100.34±17.18 | 0.000* | D, C > M, E | 0.063 |
| TC/HDL-C | 4.14 (3.35-5.05) | 3.80 (3.18-4.73) | 3.83 (3.30-4.20) | 3.78 (3.23-4.40) | 0.230 | - | 0.013 |
| TG/LDL-C | 1.21 (0.92-1.41) | 1.09 (0.75-1.50) | 1.20 (0.91-1.65) | 1.13 (0.84-1.51) | 0.444 | - | 0.008 |
| TG/HDL-C | 2.87 (2.00-3.67) | 2.37 (1.67-3.63) | 2.71 (1.83-3.80) | 2.68 (1.55-3.63) | 0.424 | - | 0.008 |
| TG/FPG | 1.49±0.64 | 1.24±0.46 | 1.33±0.46 | 1.39±0.50 | 0.018* | D > M | 0.022 |
Normally distributed data as mean ± SD, non-normally distributed data as median, 1-3rd quartile were expressed.
BD = bipolar disorder; C = control; D = depressive; FPG = fasting plasma glucose; E = euthymic; M = manic; TG = triglyceride; TC = total cholesterol; HDL-C = high-density lipoprotein cholesterol; LDL-C = low-density lipoprotein cholesterol.
* Statistically significant (p < 0.05).

| BD | |||||||
|---|---|---|---|---|---|---|---|
| Variable | D (n=74) | M (n=88) | E (n=76) | C (n=45) | p-value | Post-hoc | Effect size |
| TyG | 8.50±0.52 | 8.36±0.43 | 8.49±0.44 | 8.48±0.43 | 0.141 | - | 0.014 |
| TyG-BMI | 231.99±29.83 | 215.56±33.03 | 227.41±29.81 | 218.67±31.84 | 0.003* | D > M | 0.042 |
| METS-IR | 41.26±5.39 | 39.03±6.63 | 40.60±5.71 | 38.26±5.79 | 0.005* | D > C | 0.039 |
| BD (n=238) | |||||||
| TyG | 8.45±0.47 | 8.48±0.43 | 0.498 | - | -0.065 | ||
| TyG-BMI | 224.45±31.72 | 218.67±31.84 | 0.142 | - | 0.182 | ||
| METS-IR | 40.22±6.03 | 38.26±5.79 | 0.008* | - | 0.330 | ||
Normally distributed data as mean ± SD, non-normally distributed data as median, 1-3rd quartile were expressed.
BD = bipolar disorder; C = control; D = depressive; M = manic; METS-IR = metabolic score index for insulin resistance; TyG = triglyceride glucose index; TyG-BMI = triglyceride glucose-body mass index.
* Statistically significant (p < 0.05).




When analyzing the correlations within the groups, the correlations between the indices and the parameters used in these indices, the correlations between the lipid parameters (e.g., TyG-BMI:METS-IR, TyG:FPG, TC:LDL-C) were strong (r > 0.70, p < 0.01) and in the expected direction. In addition, a strong negative correlation (p < 0.01) between HDL-C and METS-IR in all groups was one of our important findings. Some other notable correlations are shown in Table 4.
| Groups/correlations | Correlation coefficient (r) | Strength | p-value |
|---|---|---|---|
| Control (n=90) | |||
| TyG-BMI:METS-IR | 0.873 | Strong | p < 0.01 |
| Age:TyG-BMI | 0.248 | Weak | p < 0.05 |
| Age:TC | 0.220 | Weak | |
| Age:TG | 0.249 | Weak | |
| Depressive (n=74) | |||
| TG/HDL:METS-IR | 0.649 | Moderate | p < 0.01 |
| TC/HDL:METS-IR | 0.521 | Moderate | |
| Age:LDL-C | 0.402 | Moderate | |
| FPG:Age of first mood episode | 0.335 | Weak | p < 0.05 |
| Age:BMI | 0.332 | Weak | |
| Manic (n=88) | |||
| Age:BMI | 0.456 | Moderate | p < 0.01 |
| Age:TC | 0.400 | Moderate | |
| Age:LDL-C | 0.389 | Weak | |
| Age:FPG | 0.381 | Weak | |
| Age:TyG-BMI | 0.379 | Weak | |
| Age:METS-IR | 0.308 | Weak | p < 0.05 |
| Euthymic (n=76) | |||
| TG/HDL:METS-IR | 0.712 | Strong | p < 0.01 |
| TC/HDL:METS-IR | 0.589 | Moderate | |
| Age:TyG-BMI | 0.235 | Weak | p < 0.05 |
| BD (n=228) | |||
| Age:TyG-BMI | 0.328 | Weak | p < 0.05 |
| Age:BMI | 0.320 | Weak | |
| Age:TC | 0.308 | Weak |
FPG = fasting plasma glucose; METS-IR = metabolic score index for insulin resistance; TyG = triglyceride glucose index; TyG-BMI = triglyceride glucose-body mass index; TC = total cholesterol; HDL-C = high-density lipoprotein cholesterol; LDL-C = low-density lipoprotein cholesterol.
Spearman's correlation test, significance accepted at p < 0.05.
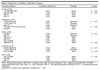
The predictive power of the TG/FPG ratio, the TyG, the TyG-BMI, and the METS-IR was assessed using ROC curves and AUC analyses. The highest AUC and p-values obtained when comparing the groups are shown in Table 5.
| 95%CI | |||||||||
|---|---|---|---|---|---|---|---|---|---|
| Groups/variables | AUC | Asymptotic Sig | Lower bound | Upper bound | Cutoff | Sn (%) | Sp (%) | PPV (%) | NPV (%) |
| BD overall vs. controls | |||||||||
| METS-IR | 0.599 | 0.006 | 0.406 | 0.548 | - | - | - | - | - |
| Depressive BD vs. controls | |||||||||
| METS-IR | 0.652 | 0.001 | 0.567 | 0.736 | 41.23 | 54.1 | 74.4 | 63.5 | 66.3 |
| TyG-BMI | 0.628 | 0.005 | 0.542 | 0.715 | 230.47 | 58.1 | 67.8 | 59.7 | 66.3 |
| Euthymic vs. controls | |||||||||
| METS-IR | 0.618 | 0.009 | 0.533 | 0.704 | 39.01 | 59.2 | 57.8 | 54.2 | 62.7 |
| TyG-BMI | 0.598 | 0.030 | 0.511 | 0.685 | |||||
AUC = area under the curve; BD = bipolar disorder; METS-IR = metabolic score index for insulin resistance; PPV = positive predictive value; NPV = negative predictive value; ROC = receiver operating characteristic; Sn = sensitivity; Sp = specificity; TyG-BMI = triglyceride glucose-body mass index.
Statistical significance accepted at p < 0.05.
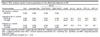
Multiple logistic regression analysis was performed to determine the predictive association of mood states with selected variables. Three different models were applied due to multicollinearity between TG/FPG, TyG-BMI, and METS-IR. TyG-BMI was a statistically significant predictor of euthymic and depressed states in BD patients (p = 0.048; p = 0.015, respectively). METS-IR was a statistically significant predictor for BD overall (n=248), as well as for euthymic and depressed states of BD (p = 0.004; p = 0.004; p = 0.002, respectively) (Table 6).
| Age | Gender | TG/FPG | TyG-BMI | METS-IR | ||
|---|---|---|---|---|---|---|
| BD (n=238) | OR | 0.995 | 0.751 | 0.888 | - | - |
| Model 1 | 95%CI | 0.974-1.017 | 0.458-1.232 | 0.560-1.408 | - | - |
| p-value | 0.678 | 0.257 | 0.614 | - | - | |
| BD (n=238) | OR | 0.990 | 0.756 | - | 1.007 | - |
| Model 2 | 95%CI | 0.969-1.013 | 0.462-1.237 | - | 0.998-1.015 | - |
| p-value | 0.396 | 0.266 | - | 0.111 | - | |
| BD (n=238) | OR | 0.988 | 0.693 | - | - | 1.066 |
| Model 3 | 95%CI | 0.967-1.010 | 0.421-1.142 | - | - | 1.021-1.113 |
| p-value | 0.285 | 0.150 | - | - | 0.004 | |
| Euthymic (n=76) | OR | 0.991 | 0.753 | 0.827 | - | - |
| Model 1 | 95%CI | 0.961-1.022 | 0.397-1.428 | 0.434-1.577 | - | - |
| p-value | 0.568 | 0.384 | 0.565 | - | - | |
| Euthymic (n=76) | OR | 0.306 | 0.346 | - | 0.048 | - |
| Model 2 | 95%CI | 0.953-1.015 | 0.388-1.393 | - | 1.000-1.021 | - |
| p-value | 0.306 | 0.346 | - | 0.048 | - | |
| Euthymic (n=76) | OR | 0.982 | 0.640 | - | - | 1.088 |
| Model 3 | 95%CI | 0.951-1.014 | 0.332-1.233 | - | - | 1.027-1.153 |
| p-value | 0.274 | 0.182 | - | - | 0.004 | |
| Manic (n=88) | OR | 0.975 | 0.738 | 0.552 | - | - |
| Model 1 | 95%CI | 0.947-1.005 | 0.396-1.376 | 0.293-1.042 | - | - |
| p-value | 0.100 | 0.339 | 0.067 | - | - | |
| Manic (n=88) | OR | 0.977 | 0.652 | - | 0.999 | - |
| Model 2 | 95%CI | 0.947-1.007 | 0.356-1.194 | - | 0.989-1.009 | - |
| p-value | 0.135 | 0.166 | - | 0.838 | - | |
| Manic (n=88) | OR | 0.971 | 0.623 | - | - | 1.036 |
| Model 3 | 95%CI | 0.941-1.001 | 0.338-1.149 | - | - | 0.985-1.089 |
| p-value | 0.059 | 0.130 | - | - | 0.167 | |
| Depressive (n=74) | OR | 1.018 | 0.810 | 1.411 | - | - |
| Model 1 | 95%CI | 0.990-1.047 | 0.431-1.524 | 0.812-2.454 | - | - |
| p-value | 0.221 | 0.514 | 0.222 | - | - | |
| Depressive (n=74) | OR | 1.009 | 0.888 | - | 1.013 | - |
| Model 2 | 95%CI | 0.980-1.039 | 0.471-1.674 | - | 1.003-1.024 | - |
| p-value | 0.535 | 0.713 | - | 0.015 | - | |
| Depressive (n=74) | OR | 1.011 | 0.781 | - | - | 1.099 |
| Model 3 | 95%CI | 0.982-1.041 | 0.410-1.490 | - | - | 1.036-1.165 |
| p-value | 0.449 | 0.453 | - | - | 0.002 |
Bold type denotes statistical significance (p < 0.05).
BD = bipolar disorder; METS-IR = metabolic score index for insulin resistance; OR = odds ratio; TG/FPG = triglyceride/fasting plasma glucose; TyG-BMI = triglyceride glucose-body mass index.
DISCUSSION
In this study, we compared the TyG, TyG-BMI, and METS-IR indices of IR between patients at different states of BD and healthy controls. The number of studies investigating the relationship between IR and BD is limited. In addition, this is the first study to compare patients in different BD states versus healthy controls using these indices. BMI and the number of suicide attempts were higher in BD patients in the depressive state than in the manic and euthymic states. The TyG-BMI was a statistically significant predictor of euthymic and depressive states in BD. The METS-IR was a statistically significant predictor of BD overall, as well as of the euthymic and depressive states of BD.
Among psychiatric disorders, BD is associated with a particularly high suicide rate. In addition to natural causes such as cardiovascular disease and diabetes, the high number of suicides significantly increases mortality rates in BD. Factors such as socioeconomic reasons, age, and gender may influence suicidality. Most suicide attempts and completed suicides occur during depressive periods.28-30 In our study, there were no significant differences in age, gender, years of education, seasonality, etc. between different states of BD. However, the number of suicide attempts was significantly higher among patients in the depressive states than in the manic and euthymic states, which is consistent with the literature.
Clinical studies have highlighted that more than 60% of people with BD struggle with obesity. In the presence of obesity, the course of BD worsens, the frequency of episodes increases, the severity of symptoms increases, the response to lithium-based treatment decreases, and suicidal ideation and attempts increase.31,32 In a 2016 study of 52 patients diagnosed with BD and 22 healthy controls, BMI was significantly higher in the patient group compared to healthy controls.33 In a study evaluating the atherogenic plasma index in manic, depressive, euthymic states and in healthy controls, researchers found no significant difference between groups in terms of BMI levels.30 In our study, we found that BMI levels were significantly higher in BD patients in depressive state compared to BD patients in manic state and healthy controls. Differences in age, gender, and number of participants in the studies may account for the differences between the results. High BMI in the depressive state was a result we predicted due to restricted movement, loss of motivation, sleep disturbances, and increased eating.
In patients with BD, risk factors, etiological mechanisms, and chronic use of psychotropic drugs are associated with cardiovascular disease risk, IR, and a high incidence of diabetes; thus, alterations in blood glucose and lipid profiles are common.4,6,30 The risk of cardiometabolic disease in people with BD has also been shown to precede the use of psychotropic drugs, which suggests that the disease itself contributes to cardiometabolic risk.30 For this reason, we excluded patients with a diagnosis of or current treatment for cardiometabolic disease, so as not to influence the results of our study. For this reason, we could not compare our indices and lipid parameters in relation to cardiometabolic disease. A study investigating lipid levels in young people with BD reported that young people with BD had an atherogenic lipid profile compared with healthy controls.20-22 The study found that the TG levels were significantly higher in BD patients in the euthymic state compared with BD patients in the mixed/hypomanic state and healthy controls. It was also reported that the TG/HDL-C ratio was significantly higher in BD participants in the euthymic state compared with the healthy control group, and there was no difference between the groups in terms of LDL-C, HDL-C, or TC.34 A study conducted in 2020 with 418 patients diagnosed with BD found that BD patients in the manic state had lower TC, HDL-C, and LDL-C levels compared to patients in the euthymic state. In addition, they reported that TC and LDL-C levels were significantly lower in patients in the manic state compared to patients in the depressive state, but no comparison was made with the healthy control group in the study.35 In 2007, Chung et al.36 found that severe depressive symptoms were associated with higher TC levels in type I BD patients (68 manic, eight depressive, and six mixed). More recently, Huang et al.37 analyzed lipid and glucose levels in 32 manic-state BD patients, 32 depressive-state BD patients, and 64 healthy controls and found that TC levels were significantly lower in the manic subgroup than in the depressive subgroup. In our study, TC and LDL-C levels were significantly higher in depressed BD patients and healthy controls than in manic BD patients. HDL-C levels were significantly higher in healthy controls than in BD patients in manic, euthymic, or depressive states. There were no differences between groups in FPG, TG, TC/HDL-C, TG/LDL-C, or TG/HDL-C. In the depressive state of BD, increased appetite, weight gain, inactivity, and changes in blood lipid parameters are to be expected.32 Our results are consistent with the literature, but it is clear that blood glucose and lipid levels can be influenced by various factors, including smoking, alcohol, genetics, chronic use of psychotropic drugs, physical activity and diet.
Little is known about the impact of IR on BD. The high cost and limitations of insulin measurements used to determine IR have led researchers to develop new indices. The TyG is an inexpensive alternative test used to assess IR. In a study investigating the relationship between IR and depression, researchers found that the TyG was higher in patients with depression compared to the control group.38 In a study suggesting that the TyG could be used as a predictor of IR in schizophrenia patients, researchers found the AUC for the TyG to be 0.758.39 Another study investigating the TyG for the detection of IR in major depressive disorder reported a positive correlation between the TyG and the likelihood of psychotic symptoms.40 In a study conducted in 2019 with 104 patients diagnosed with BD, researchers found the AUC value to be 0.787 using the TyG to determine IR and reported that the TyG has high sensitivity and specificity in detecting IR.41 However, in this 2019 study, patients were divided into two groups according to their HOMA-IR levels (less than 2 and 2 and above), and since FPG would be high in the group with high HOMA-IR, the researchers obtained good results in terms of TyG between the groups. There are no published investigations comparing BD in terms of TG/FPG and TyG grouping patients by BD state as in our study. In our sample, the TG/FPG in BD patients was significantly higher in the depressive period than in the manic period. There was no significant difference in TyG between the groups. In our study, there were no patients diagnosed with IR or diabetes in our patient groups, and there was no difference in FPG and TG between the groups. However, there was a significant difference in BMI between the patient and control groups. In addition, BMI was significantly higher in the depressed group than in the manic and control groups. Therefore, TyG calculated with only two parameters (TG and FPG) may not have differed between the groups. We believe that TyG can be better discriminated by increasing the number of patients or by including patients diagnosed with IR and diabetes in the patient groups. As BMI is included in the calculations of TyG-BMI and METS-IR, it is possible that these indices give more sensitive and specific results than TyG.
The TyG-BMI and the METS-IR have attracted the attention of researchers because they can comprehensively detect obesity, diabetes, and metabolic abnormalities in individuals. In a study investigating the role of various parameters in predicting IR in 511 Taiwanese individuals, the authors found an AUC value of 0.708 for the TyG and 0.801 for the TyG-BMI, emphasizing that the latter may be a simple, powerful, and clinically useful marker for early diagnosis of IR.25 The results of a study conducted in 2024 highlighted an important association between higher TyG-BMI levels and an increased prevalence of depression.42 In 2024, a study examining the association between the TyG-BMI and suicide attempts in people with major depressive disorder suggested that suicide attempts in people with depression may be associated with both increased and decreased TyG-BMI levels.43 A study investigating the relationship between METS-IR and T2DM reported that each unit increase in METS-IR was associated with a 7% increase in the risk of T2DM.20 Another study investigating the relationship between IR and depression, it was reported that higher METS-IR scores were associated with an increased likelihood of experiencing depressive symptoms.44 In our study, we obtained the most valuable data with the TyG-BMI and the METS-IR. The TyG-BMI was significantly higher in depressive BD patients than in manic-state BD patients, and the METS-IR was significantly higher in depressive-state BD patients than in the control group. When we compared whole group of BD patients regardless of current state (n=238) with the healthy control group, we found that there was no difference in TyG-BMI, while METS-IR values were significantly higher in the patient group and the AUC value in the ROC analysis was 0.599. In addition, we obtained significant results in the ROC analysis for both the METS-IR and the TyG-BMI in discriminating depressed and euthymic BD patients from healthy controls. We also found that the TyG-BMI was a statistically significant predictor of euthymic and depressive states of BD. The METS-IR was a statistically significant predictor of euthymic state, depressive state, and BD overall on logistic regression. There are no studies in the literature evaluating these two indices in patients with BD; therefore, we could not compare our results to those of previous investigations. In addition, because we did not have clear data on the psychotropic drugs and doses used by our patients, we could not assess the relationship between these drugs and the indices of interest. Despite this lack of specific information on the treatment of manic- and depressive-state patients, we do know that mood stabilizers and antipsychotics were used in the euthymic period. Studies in the literature have shown that mood stabilizers and antipsychotics are associated with an increase in BMI, dyslipidemia, and IR.30,34,35
Our study has some limitations. First, due to the single-center, cross-sectional, retrospective design, associations are not prospective, and causality cannot be inferred. Second, although we were able to assess BD according to mood, the sample size was small for both the patient and control groups. Third, even if there is no difference between groups in terms of smoking and alcohol consumption, possible limitations are that uncontrollable factors such as genetic characteristics, family history, lifestyle, and diet were not assessed. Fourth, we could not analyze the pharmacological effect because we did not have information on the use of psychotropic drugs, statins, or antidiabetic agents, which may influence FPG, lipids, BMI, IR, and proinflammatory parameters. Finally, the lack of HOMA-IR and HbA1c results, which are used to determine IR and with which we could have compared our indices, is an important limitation. We therefore recommend that our results be considered preliminary and that prospective and experimental studies be performed to confirm whether TyG, TyG-BMI, and METS-IR can predict IR in different BD states.
In this study, we obtained important data regarding the TyG-BMI and the METS-IR in BD. In our sample, BMI and number of suicide attempts were significantly higher in BD patients in the depressive state than in BD patients in the manic and euthymic states. The TyG-BMI was significantly higher in depressed BD patients than in manic BD patients, and the METS-IR was significantly higher in depressed-state BD patients than in healthy controls. In the BD patient group (n=248), regardless of current mood state, we found that BMI and METS-IR levels were significantly higher than in healthy controls. In addition, the METS-IR was a statistically significant predictor for euthymic-state BD, depressed-state BD, and belonging to the BD group overall. In the ROC analysis, we obtained the highest AUC values for TyG-BMI and METS-IR to discriminate the patient groups from healthy controls. In conclusion, our results are remarkable as the first to provide evidence that elevated METS-IR and TyG-BMI may be an indicators of IR in BD patients, and can be used to differentiate BD patients from healthy controls. Measurement and monitoring of low-cost alternative tools such as TyG-BMI and METS-IR to detect IR in BD may help early identification of high-risk individuals, allowing routine screening, prospective study, risk assessment, and therapeutic monitoring before disease onset. However, there is a need for confirmation of these results in larger studies before definitive conclusions can be drawn.
Given the limitations of our study, we recommend that a prospective study be planned to demonstrate the power of the indices tested herein to detect IR. Such a study should include well-established IR markers such as HbA1c and HOMA-IR, information on psychotropic drugs used by patients, family history, and lifestyle and dietary habits.
 PDF
 Print
 Send this article by email
 How to cite this article
 Submit a comment
 Mendeley
 Pocket
 Share on Facebook
 Share on Twitter